- Bitcoin price extended decline below the $35,000 zone against the US Dollar.
- The price is now trading below $32,000 and the 55 simple moving average (4-hours).
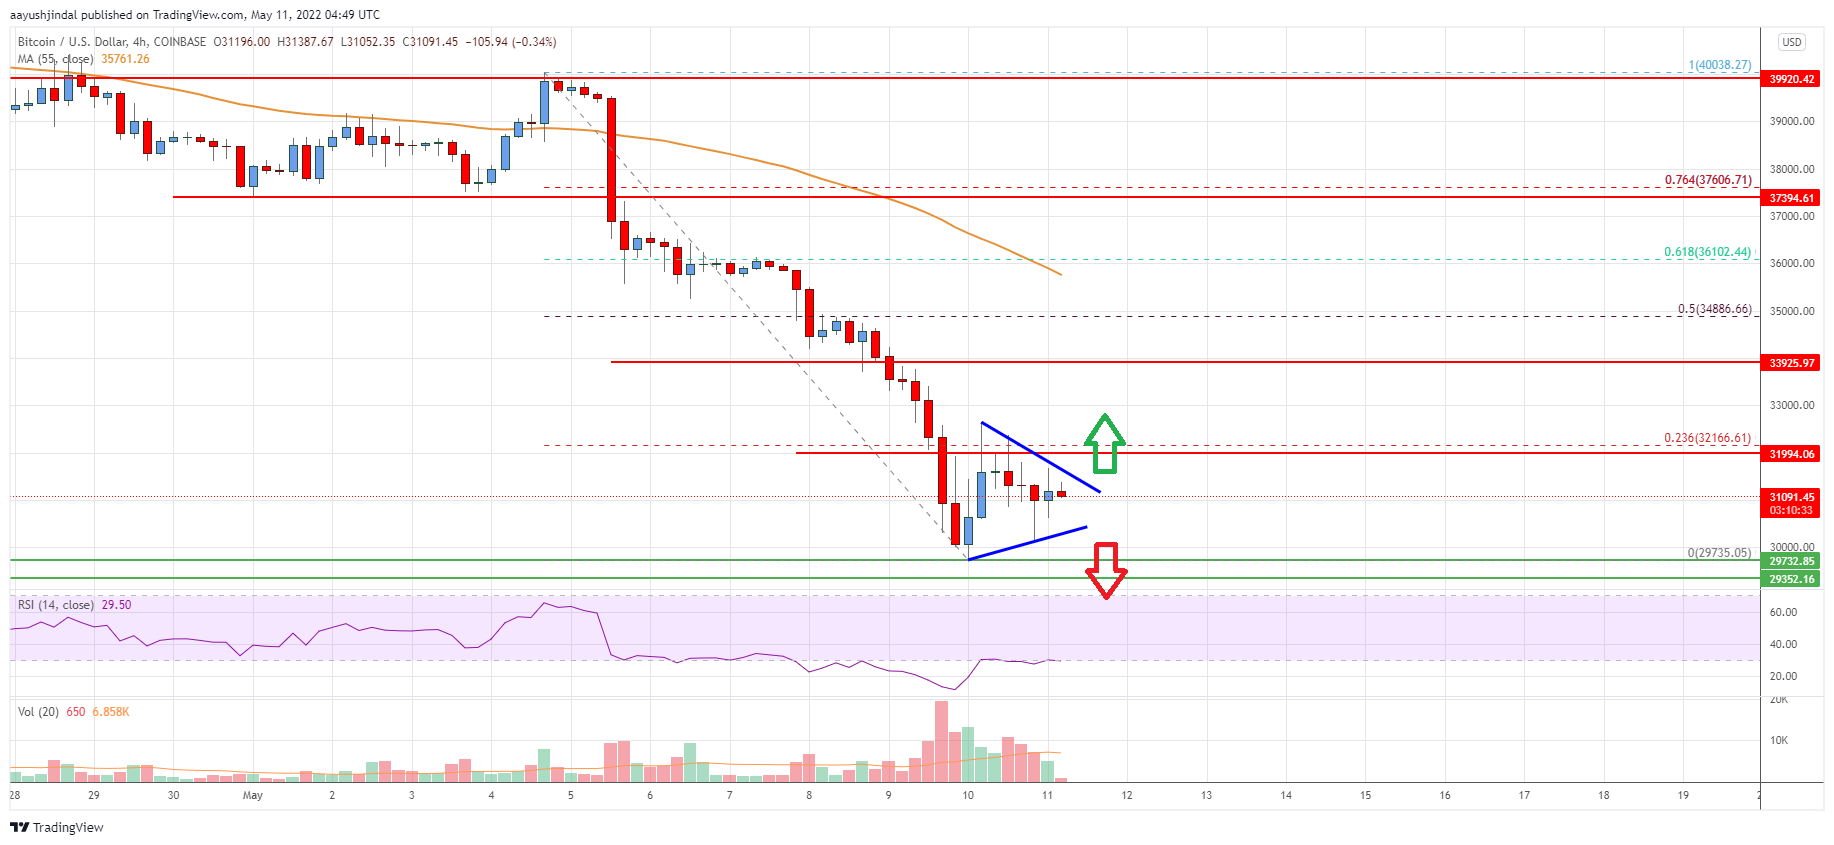
- There is a key contracting triangle forming with resistance near $31,300 on the 4-hours chart of the BTC/USD pair (data feed from Coinbase).
- The pair could start a steady increase if there is a move above the $32,000 level.
Bitcoin price is struggling below $32,000 against the US Dollar. BTC might extend losses if it stays below the $32,000 and $34,000 resistance levels.
Bitcoin Price Analysis
Bitcoin price failed to clear the $38,000 resistance zone. As a result, BTC started a fresh decline and traded below the key $35,000 support zone.
There was a clear move below the $34,000 level and the 55 simple moving average (4-hours). The price even traded below the $32,000 level. A low is formed near $29,735 and the price is now consolidating losses. There was a move above the $31,000 resistance zone.
The price even tested the 23.6% Fib retracement level of the downward move from the $40,040 swing high to $29,735 low. An immediate resistance on the upside is near the $31,300 level.
There is also a key contracting triangle forming with resistance near $31,300 on the 4-hours chart of the BTC/USD pair. The next major resistance on the upside is near the $32,000 level. To start another increase, the price must settle above the $32,000 level in the near term.
In the stated case, bitcoin could rise towards the $34,000 resistance or even the 50% Fib retracement level of the downward move from the $40,040 swing high to $29,735 low.
If there is no upside break, the price might start a fresh decline below $30,400. The next key support is near the $30,000 level. Any more losses might call for a test of the $28,500 support zone, where the bulls might take a stand in the near term.

Looking at the chart, bitcoin price is clearly trading below $32,000 and the 55 simple moving average (4-hours). Overall, the price could start a steady increase if there is a move above the $32,000 level.
Technical Indicators
4 hours MACD – The MACD is now losing momentum in the bearish zone.
4 hours RSI (Relative Strength Index) – The RSI is now below the 40 level.
Key Support Levels – $30,400 and $30,000.
Key Resistance Levels – $31,300, $32,000 and $34,000.


Leave a Reply
You must be logged in to post a comment.