- Bitcoin price corrected lower sharply below $5,200 and tested $4,960 against the US Dollar.
- The price bounced back after trading as low as $4,966 and rebounded above $5,220.
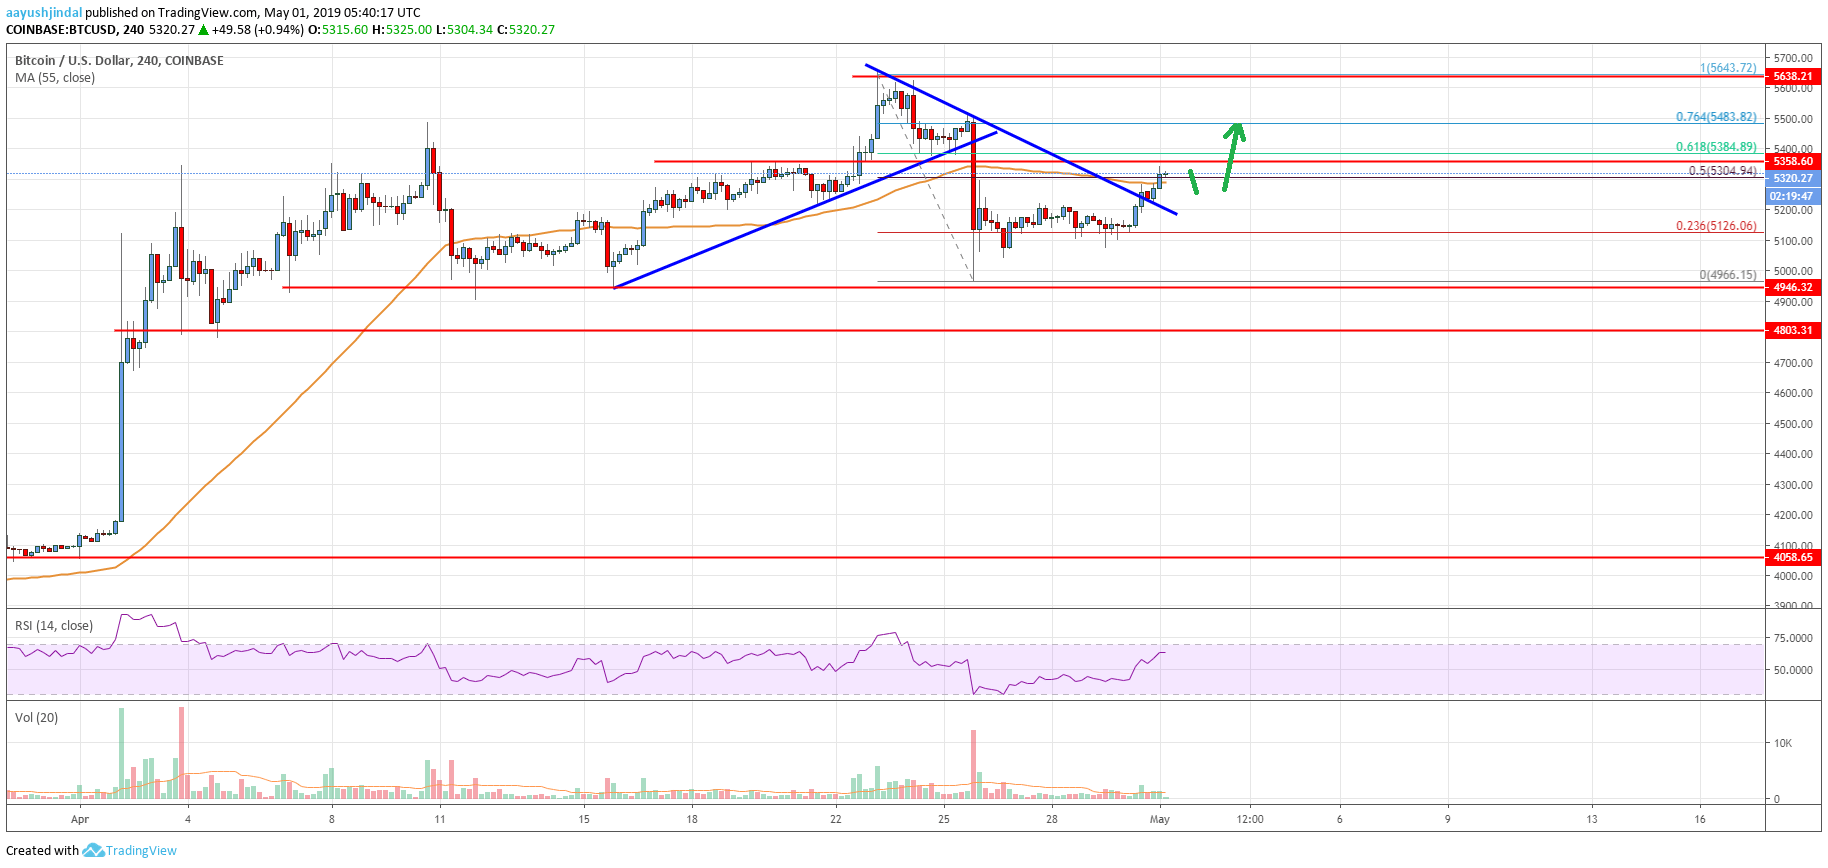
- There was a break above a key bearish trend line with resistance near $5,200 on the 4-hours chart of the BTC/USD pair (data feed from Coinbase).
- The pair is back in an uptrend and it could continue to rise towards the $5,400 and $5,550 levels.
Bitcoin price corrected lower sharply, but bounced back recently against the US Dollar. BTC is trading above $5,240 and it could continue to grind higher towards $5,550 or even $5,650.
Bitcoin Price Analysis
This past week, there was a sharp downside correction in bitcoin price below $5,300 against the US Dollar. The BTC/USD pair traded below the key $5,220 and $5,150 support levels. There was even a break below the $5,000 support and the 55 simple moving average (4-hours). More importantly, the price broke a major bullish trend line on the 4-hours chart to enter a bearish zone. The price traded close to the $4,940 support area and formed a swing low at $4,966.
It seems like bitcoin completed a downside correction as it bounced back above $5,200. There was a break above $5,260 and the 23.6% Fib retracement level of the last decline from the $5,643 high to $4,966 low. Moreover, there was a break above a key bearish trend line with resistance near $5,200 on the same chart. The pair even climbed back above $5,300 and the 55 simple moving average (4-hours). It is currently trading just above the 50% Fib retracement level of the last decline from the $5,643 high to $4,966 low.
Therefore, there are chances of more gains above $5,350. An immediate resistance is near the $5,385 level. It represents the 61.8% Fib retracement level of the last decline from the $5,643 high to $4,966 low. A convincing break above $5,385 and $5,400 may set the tone for a strong rally towards $5,500. In the mentioned case, the price may even attempt to surpass $5,550 and $5,600.

Looking at the chart, bitcoin price cleared bounced back above $5,200 and $5,300. However, a successful close above $5,385 and $5,400 is needed for further upsides. If there is no upside break, there could be a fresh downside correction below $5,300. The main supports on the downside are near the $5,260 and $5,220 levels. Only a close below $5,125 might negate the current bullish view.
Technical indicators
4 hour MACD – The MACD is gaining momentum in the bullish zone.
4 hour RSI (Relative Strength Index) – The RSI is currently well above the 50 and 60 levels.
Key Support Levels – $5,260 and $5,125.
Key Resistance Levels – $5,400, $5,500 and $5,550.


Leave a Reply
You must be logged in to post a comment.