- Bitcoin price topped near the $12,320 level and started a fresh decline against the US Dollar.
- The price traded below the key $11,500 and $11,000 support levels to move into a bearish zone.
- There was a break below a major bullish trend line with support near $11,750 on the 4-hours chart of the BTC/USD pair (data feed from Coinbase).
- The pair is currently trading below the $10,750 level and it could continue to slide in the near term.
Bitcoin price is showing bearish signs below the $11,000 support against the US Dollar. BTC might continue to decline towards the $10,200 and $10,000 support levels.
Bitcoin Price Analysis
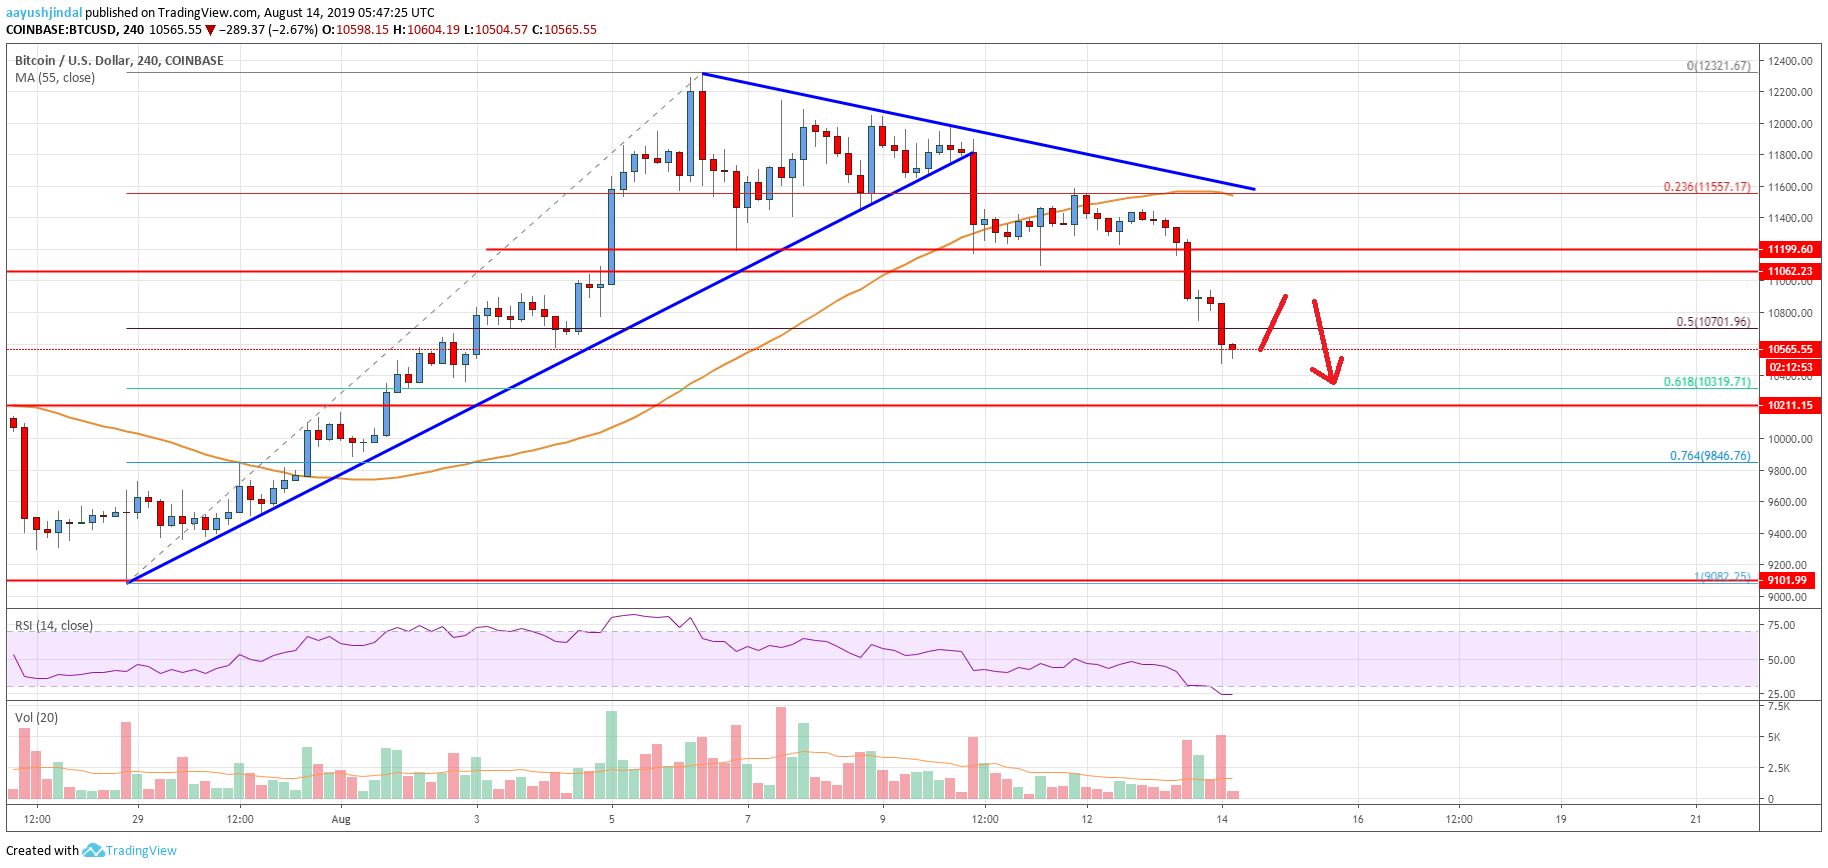
Earlier this month, bitcoin price extended gains above the $11,200 and $11,500 resistance levels against the US Dollar. There was a break above the $12,000 resistance and the 55 simple moving average (4-hours). Finally, the price tested the $12,321 level and started a major downside correction. There was a break below the $11,800 and $11,500 support levels. Moreover, the price settled below $11,500 and the 55 simple moving average (4-hours).
More importantly, there was a break below a major bullish trend line with support near $11,750 on the 4-hours chart of the BTC/USD pair. The pair is now trading below the $11,000 support plus the 50% Fib retracement level of the main major upward move from the $9,087 low to $12,321 high. An immediate support on the downside is near the $10,500 level.
The main support is near the $10,300 and $10,200 levels. It coincides with the 61.8% Fib retracement level of the main major upward move from the $9,087 low to $12,321 high. If there is a downside break below the $10,200 support area, the price could start a strong slide towards the last swing low at $9,087.
On the upside, an immediate resistance is near the $10,800 level. To start a fresh increase, the price has to surpass the $11,100 and $11,200 levels. Moreover, the 55 simple moving average (4-hours) is positioned along with a bearish trend line on the upside near $11,550, which is the next crucial hurdle.
Looking at the chart, bitcoin price is clearly trading in a downtrend from the $12,321 swing high. If the $10,200 support fails to hold the current decline, there could be a bearish extension. Conversely, if the $10,200 support holds the decline, the price could start a decent recovery towards $11,000 or even $11,550.
Technical indicators
4 hour MACD – The MACD is currently gaining momentum in the bearish zone.
4 hour RSI (Relative Strength Index) – The RSI is currently declining and is in the oversold zone.
Key Support Levels – $10,500 and $10,200.
Key Resistance Levels – $10,800, $11,000 and $11,550.