- Bitcoin price started a significant rise from the $9,134 swing low against the US Dollar.
- The price surged above the $11,000 and $12,000 levels before starting a downside correction.
- There is a crucial bullish trend line forming with support near $11,350 on the 4-hours chart of the BTC/USD pair (data feed from Coinbase).
- The pair could continue to climb high as long as it is trading above the $11,000 support area.
Bitcoin price is trading with a bullish bias above $11,000 against the US Dollar. BTC is likely accelerate further unless the bears push the price below $11,000.
Bitcoin Price Analysis
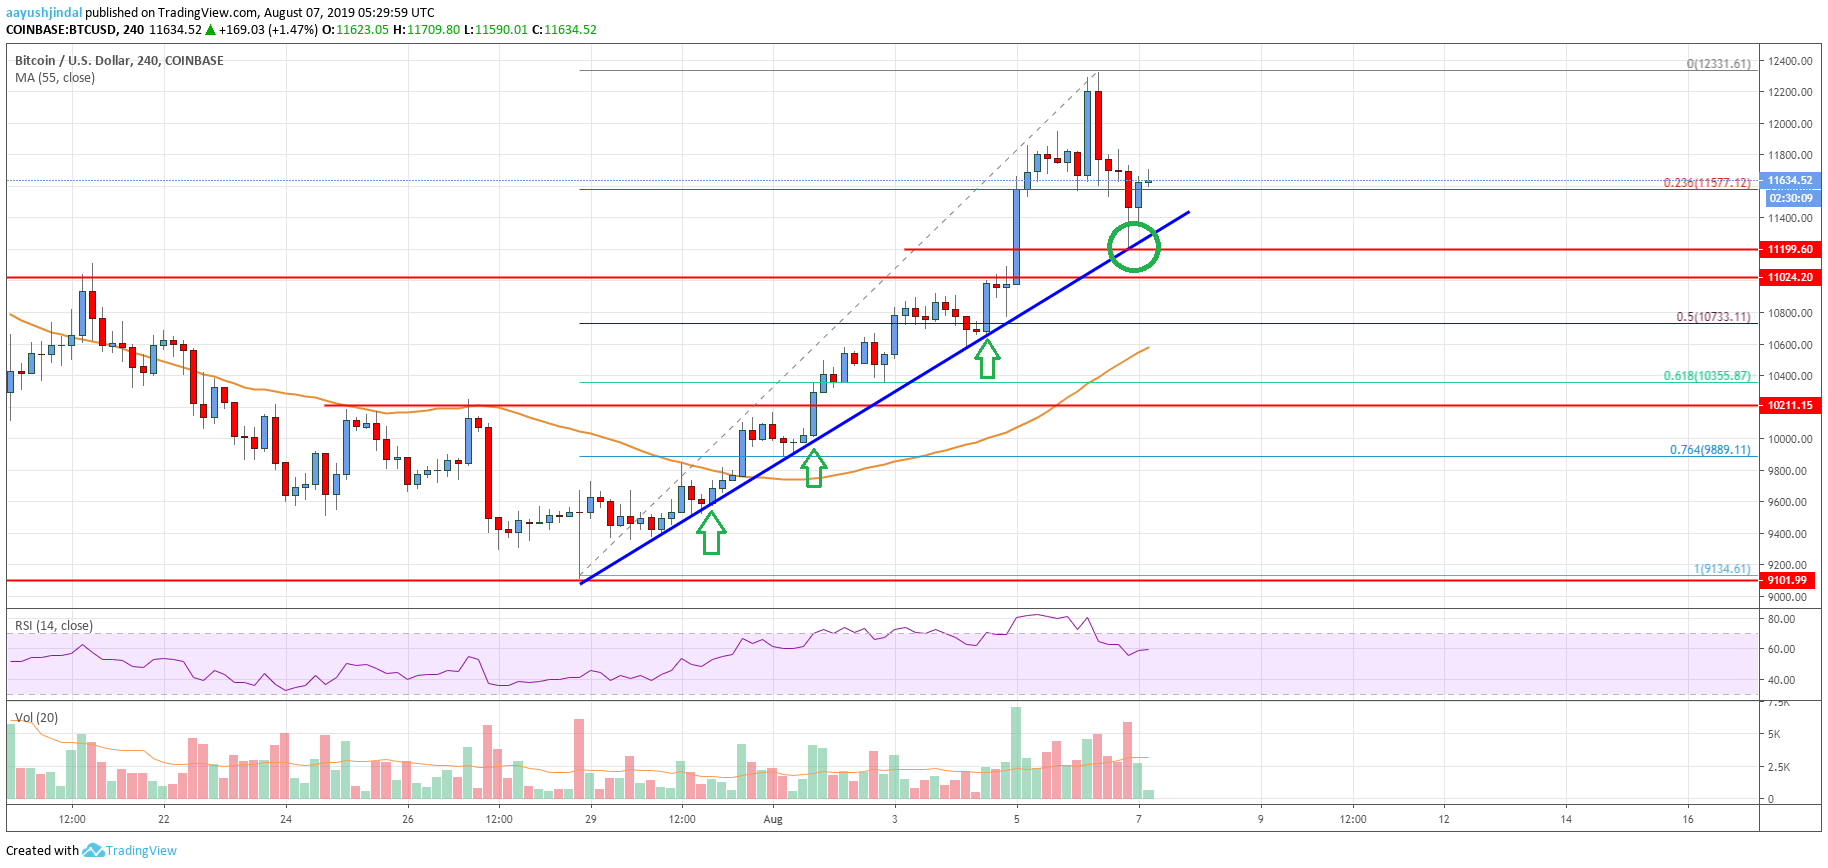
In the past few days, bitcoin price followed a bullish path above $11,000 against the US Dollar. The BTC/USD pair broke the key $11,200 and $11,500 resistance levels to move into a positive zone. Moreover, there was a break above the $12,000 level plus a close above the 55 simple moving average (4-hours). Finally, the price traded above the $12,300 level and a new monthly high was formed near $12,330.
Recently, the price started a downside correction below the $12,000 support level. Moreover, there was a break below the 23.6% Fib retracement level of the last major upward move from the $9,134 low to $12,331 high. However, the decline was protected by the $11,200 level. More importantly, there is a crucial bullish trend line forming with support near $11,350 on the 4-hours chart of the BTC/USD pair.
The pair stayed above the $11,000 support level and it is currently moving higher. An immediate resistance is near the $11,800 level, above which the price could retest $12,000. Additionally, if there is a fresh break above the $12,000 resistance, the price could even break the $12,331 high. The next key resistance is near the $12,800 level.
Conversely, if the price fails to climb above the $11,800 and $12,000 resistances, there could be a fresh decline. A clear break below the trend line might push the price below the $11,200 support. The main support is near the $11,000 level. Any further losses might push the price towards $10,730. It represents the 50% Fib retracement level of the last major upward move from the $9,134 low to $12,331 high.

Looking at the chart, bitcoin price is trading in a solid uptrend above $11,200 and $11,000. Therefore, it could continue to rise above $12,000. Only a daily close below $11,000 might negate the current uptrend.
Technical indicators
4 hour MACD – The MACD is slowly gaining pace in the bullish zone.
4 hour RSI (Relative Strength Index) – The RSI is currently well above the 50 level, with a positive bias.
Key Support Levels – $11,200 and $11,000.
Key Resistance Levels – $11,800, $12,000 and $12,350.


Leave a Reply
You must be logged in to post a comment.