- Bitcoin price declined steadily below $10,200 and tested the $9,110 support against the US Dollar.
- The price is currently recovering, but it is approaching the $9,800 and $10,000 resistances.
- There are two bearish trend lines forming with resistance near $9,800 and $9,900 on the 4-hours chart of the BTC/USD pair (data feed from Coinbase).
- The pair is likely to surge significantly if there is successful break above $10,000 and $10,000.
Bitcoin price is attempting a substantial recovery above $9,700 against the US Dollar. However, BTC must settle above $10,000 and $10,200 to start an uptrend.
Bitcoin Price Analysis
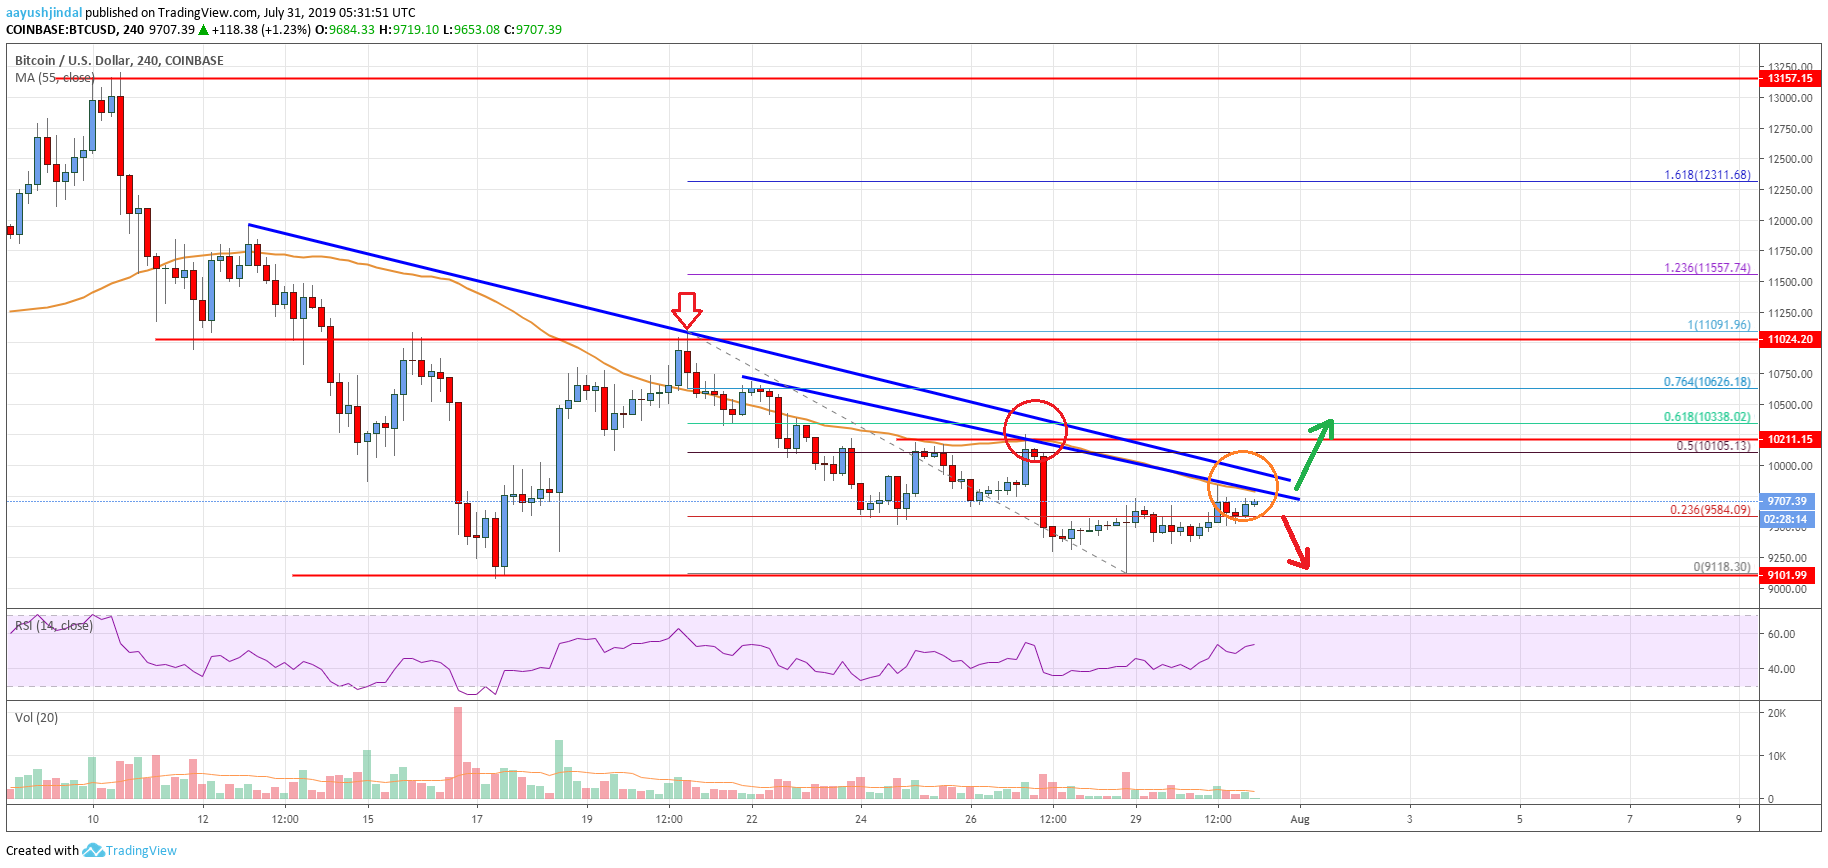
In the past few days, bitcoin price declined steadily from the $11,000 resistance against the US Dollar. The BTC/USD pair broke the key $10,500 and $10,200 support levels to enter a bearish zone. Moreover, there was a close below the $10,200 level and the 55 simple moving average (4-hours). A swing low was formed near $9,118 and the price recently started an upside correction.
It broke the $9,500 level plus the 23.6% Fib retracement level of the last major decline from the $11,091 high to $9,118 swing low. However, the price is facing a lot of hurdles on the upside near $9,800, $9,900 and $10,000. Moreover, there are two bearish trend lines forming with resistance near $9,800 and $9,900 on the 4-hours chart of the BTC/USD pair.
Above the trend lines, the 50% Fib retracement level of the last major decline from the $11,091 high to $9,118 swing low could act as a resistance. The main resistance is near the $10,200 level. Therefore, a successful close above the 55 simple moving average (4-hours) and a follow through above $10,200 is needed for upside acceleration in the coming days.
Conversely, if the price continues to struggle near $9,800, $9,900 and $10,000, then the bulls might take a back seat. On the downside, an immediate support is near the $9,500 level, below which the price could test the $9,250 support. The main support and buy zone is near the $9,100 level, below which the price could dive towards $8,500.

Looking at the chart, bitcoin price is clearly approaching a few important resistances near $9,900 and $10,000. The price action suggests high chances of an upside break above $10,000 and $10,200. Only a daily close below the $9,100 level might negate the chances of an upside break. In the mentioned bearish case, the price could test $9,000 or $8,500.
Technical indicators
4 hour MACD – The MACD is slowly gaining momentum in the bullish zone.
4 hour RSI (Relative Strength Index) – The RSI is currently above the 50 level, with a bullish angle.
Key Support Levels – $9,500 and $9,100.
Key Resistance Levels – $9,800, $10,000 and $10,200.


Leave a Reply
You must be logged in to post a comment.