- Bitcoin price declined heavily and broke the key $10,000 support level against the US Dollar.
- The price is currently under pressure and it recently traded towards the $9,250 level.
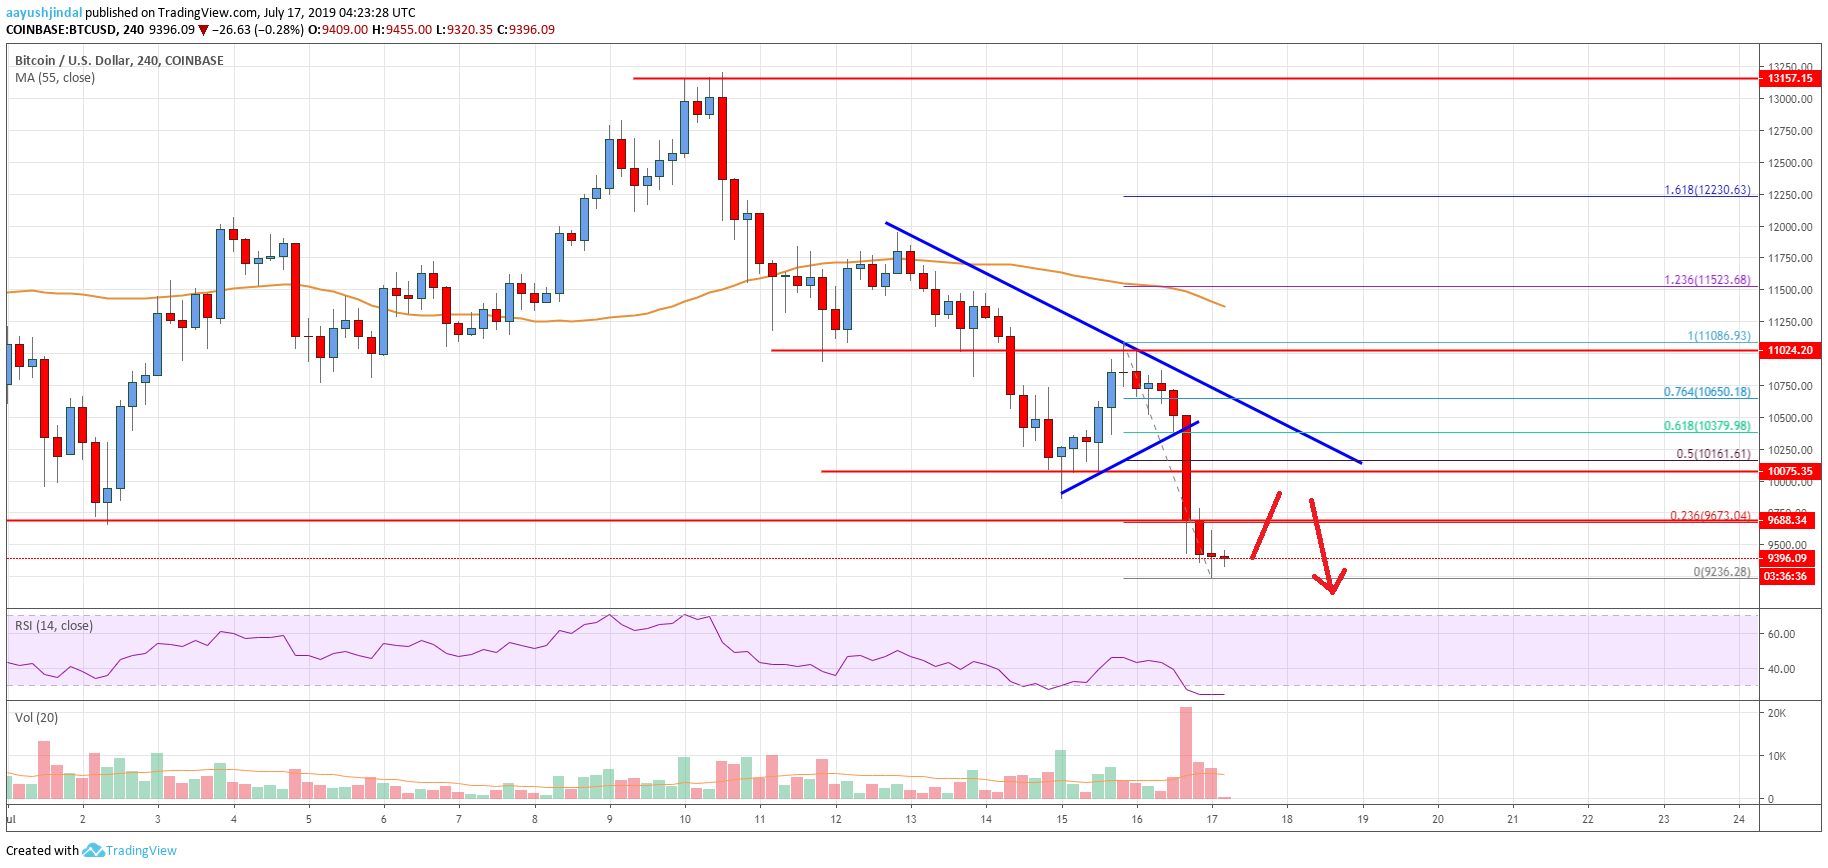
- There is a key bearish trend line forming with resistance near $10,150 on the 4-hours chart of the BTC/USD pair (data feed from Coinbase).
- The pair is likely to continue lower and it may even break the $9,000 support level in the coming sessions.
Bitcoin price is currently under a lot of pressure below the $10,000 support against the US Dollar. BTC could accelerate losses towards the $9,000 or $8,800 level in the near term.
Bitcoin Price Analysis
This week, there was a downside break in bitcoin price below the $11,000 support against the US Dollar. The BTC/USD pair started a major downward move and even broke the $10,600 support zone. Finally, there was a break below the $10,000 support and the price settled well below the 55 simple moving average (4-hours). The price traded towards the $9,200 level and a new monthly low was formed near $9,236.
At the outset, the price is consolidating losses above $9,250. An immediate resistance is near the $9,670 level. It was a breakdown level and now coincides with the 23.6% Fib retracement level of the downward move from the $11,086 high to $9,236 swing low. Moreover, there is a key bearish trend line forming with resistance near $10,150 on the 4-hours chart of the BTC/USD pair.
The trend line is close to the 50% Fib retracement level of the downward move from the $11,086 high to $9,236 swing low. Therefore, if there is an upside correction, the price is likely to face a strong resistance near the $9,700 and $10,000 levels. If there is a successful close above the $10,000 barrier and the trend line, there are chances of a decent upward move in the near term.
On the downside, an immediate support is near the $9,250 level. If there is a downside break, the price may well test the $9,000 handle. If there are more losses, the next stop for the bears could be $8,800.

Looking at the chart, bitcoin price is trading with a strong bearish bias below the $10,000 level. Therefore, there are chances of more losses below the $9,000 support level in the near term. Only a successful close above $11,000 might push the price back in a positive zone.
Technical indicators
4 hour MACD – The MACD is gaining momentum in the bearish zone.
4 hour RSI (Relative Strength Index) – The RSI is currently well below the 35 level, with a bearish angle.
Key Support Levels – $9,000 and $8,800.
Key Resistance Levels – $9,700, $10,000 and $10,200.


Leave a Reply
You must be logged in to post a comment.