- Bitcoin price found support near the $9,680 level and started a fresh increase against the US Dollar.
- The price is up more than 10% and it recently broke the $10,500 and $11,000 resistance levels.
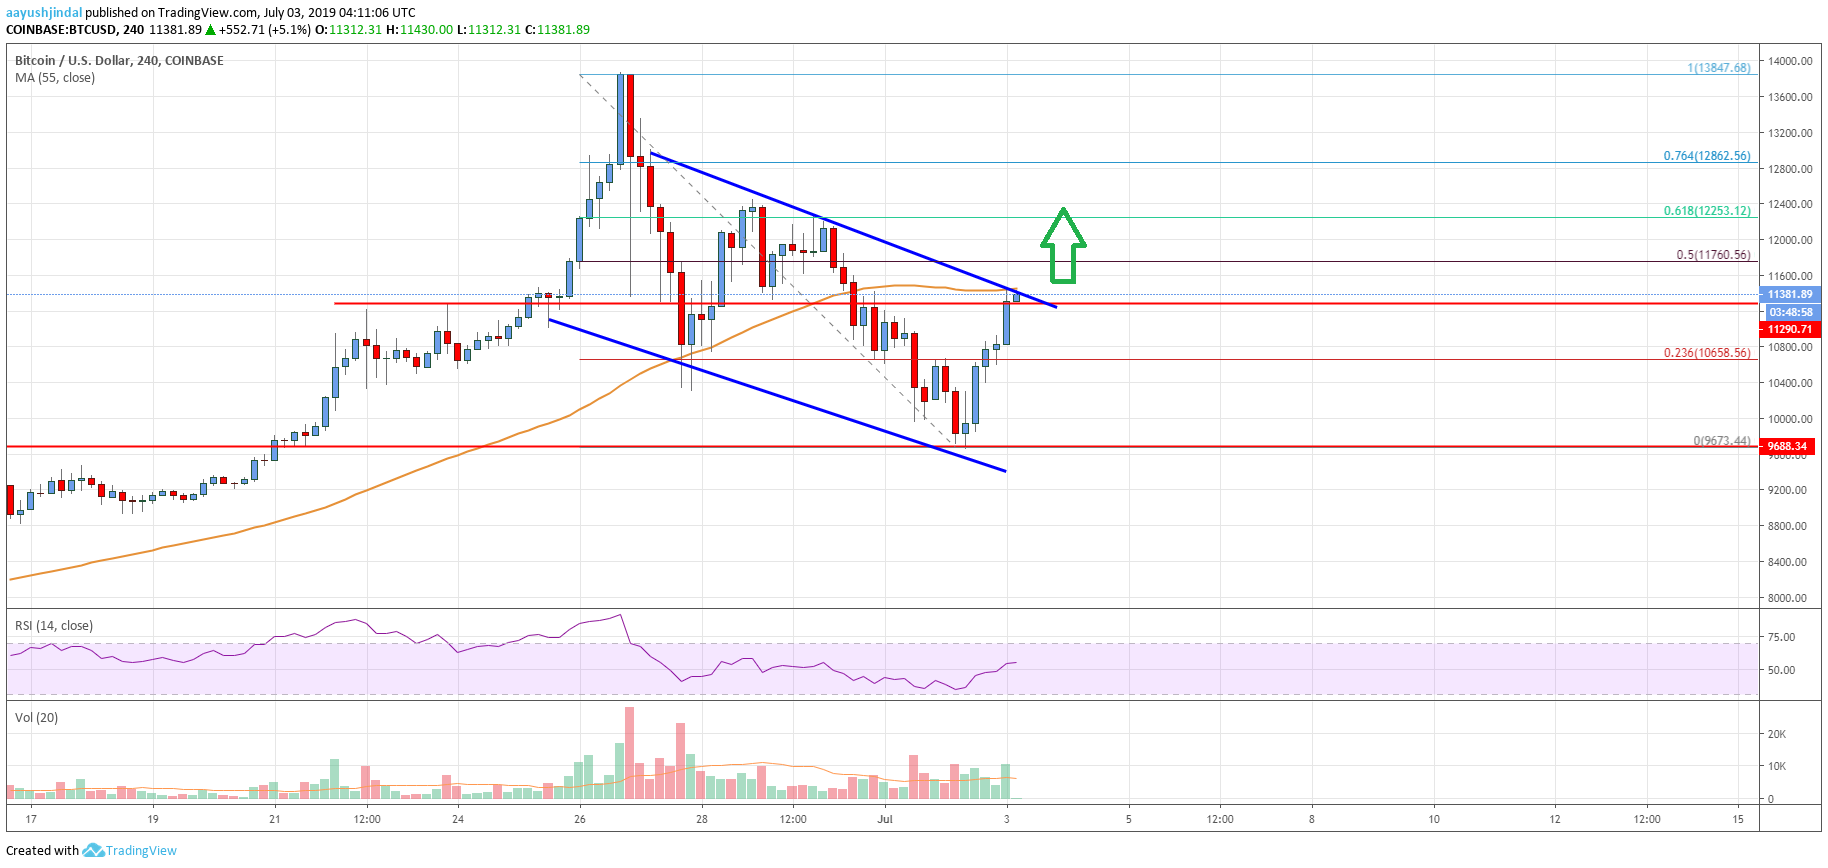
- There is a major declining channel in place with resistance near $11,500 on the 4-hours chart of the BTC/USD pair (data feed from Coinbase).
- The pair is likely to break the $11,500 and $11,600 resistance levels to continue higher in the near term.
Bitcoin price is currently gaining momentum above $11,000 against the US Dollar. BTC seems to have completed a downside correction and it could continue above $12,000.
Bitcoin Price Analysis
In the past few days, bitcoin price corrected lower significantly below $12,000 against the US Dollar. The BTC/USD pair traded as high as $13,850 and later corrected below the $12,000 and $11,000 levels. There was also a close below the $11,000 level and the 55 simple moving average (4-hours). Finally, the price even broke the $10,000 level before it found support near the $9,700 and $9,680 levels.
A swing low was formed at $9,673 and the price recently started a fresh increase. It broke the $10,000 and $10,500 resistance levels. Moreover, there was a break above the 23.6% Fib retracement level of the downward move from the $13,847 high to $9,673 swing low. It is now trading nicely above the $11,000 level. However, there are a few important hurdles near the $11,500 and $11,600 levels.
Besides, there is a major declining channel in place with resistance near $11,500 on the 4-hours chart of the BTC/USD pair. Above the channel resistance, the next hurdle could be near the $11,750 level. It coincides with the 50% Fib retracement level of the downward move from the $13,847 high to $9,673 swing low. Once there is a break above the $11,750 resistance, the price is likely to break the $12,000 barrier.
The next important resistance could be near $12,800 or the 76.4% Fib retracement level of the downward move from the $13,847 high to $9,673 swing low. On the downside, there are many supports near the $11,000 and $10,800 levels.

Looking at the chart, bitcoin price is clearly recovering nicely from the $9,673 swing low. However, a close above the $11,750 level and the 55 simple moving average (4-hours) is needed for more gains in the near term. If not, the price might decline again towards the $10,000 level.
Technical indicators
4 hour MACD – The MACD is gaining momentum in the bullish zone.
4 hour RSI (Relative Strength Index) – The RSI is currently well above the 50 level, with a bullish angle.
Key Support Levels – $11,000 and $10,800.
Key Resistance Levels – $11,500, $11,750 and $12,000.


Leave a Reply
You must be logged in to post a comment.