- ADA price declined heavily below $0.0835 before it found support near $0.0765 against the US Dollar.
- The price is currently correcting higher, but it is facing a lot of hurdles near $0.0835.
- There is a major bearish trend line forming with resistance near $0.0835 on the 4-hours chart (data feed via Kraken).
- The price could surge higher if it clears the $0.0835 and $0.0852 resistance levels.
Cardano price is currently attempting an upside break above $0.0835 against the US Dollar, but struggling vs bitcoin. ADA could start a strong rise once it settles above $0.0850.
Cardano Price Analysis
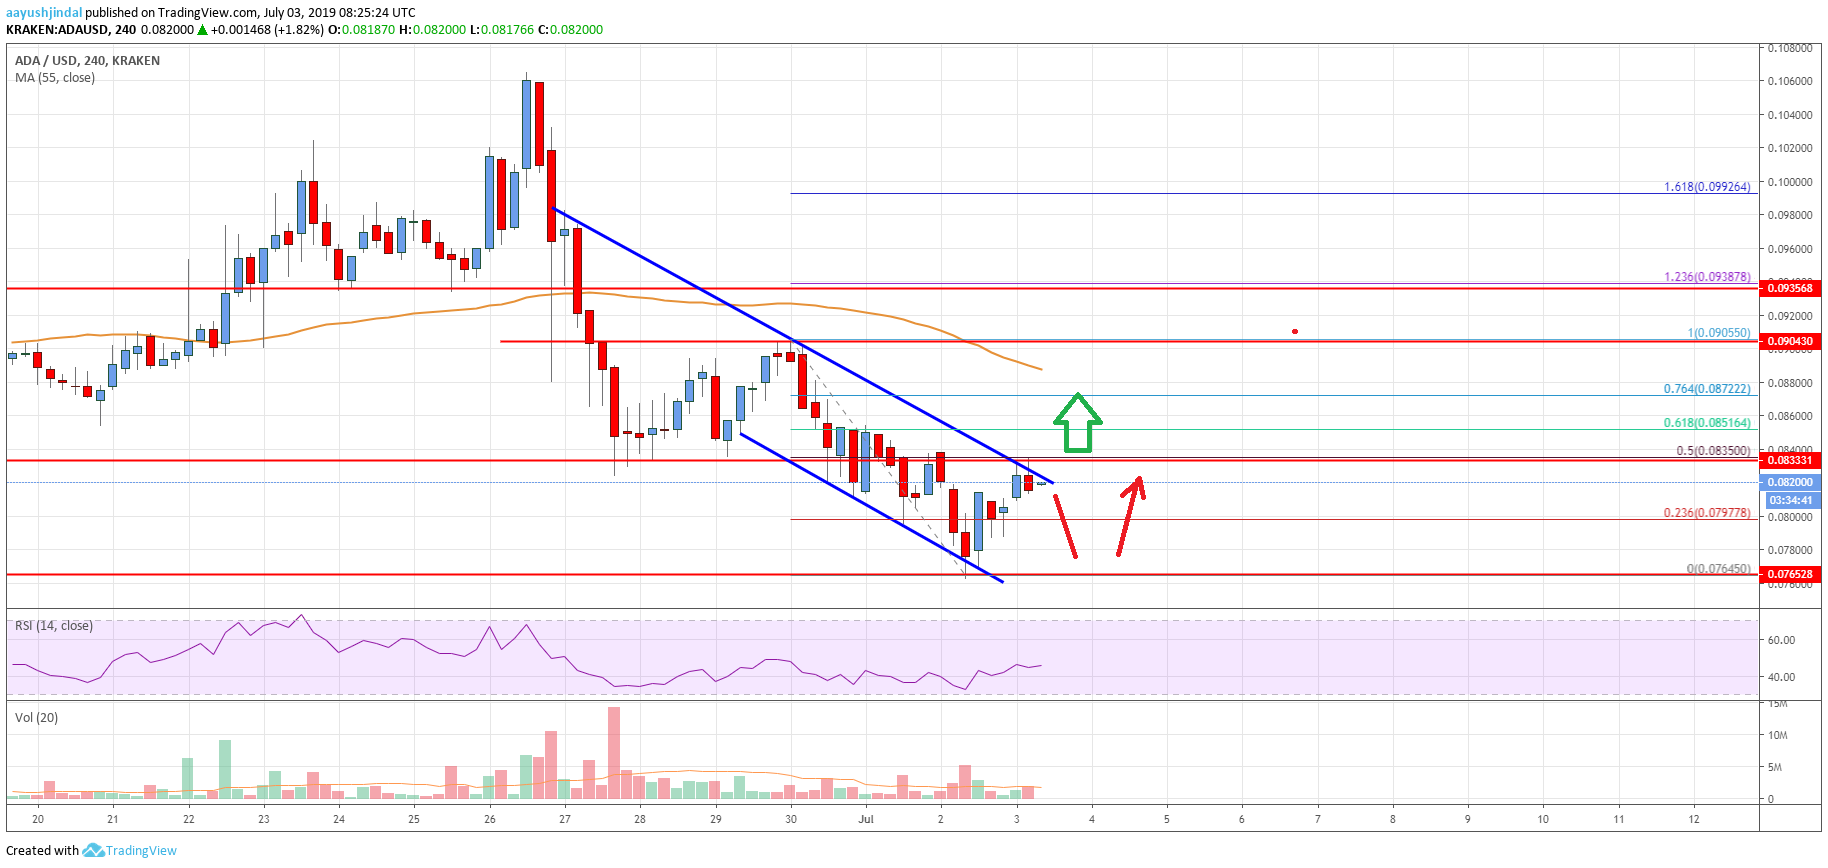
In the past few days, there was a steady decline in cardano price below $0.0900 against the US Dollar. The ADA/USD pair broke the key $0.0850 support level to enter a bearish zone. It even broke the $0.0800 support and settled well below the 55 simple moving average (4-hours). Finally, the price spiked below the $0.0780 level and traded to a new monthly low at $0.0764.
Recently, bitcoin price started a strong rise, helping cardano is starting an upside correction above $0.0780. It broke the $0.0800 resistance plus the 23.6% Fibonacci retracement level of the last decline from the $0.0905 high to $0.0764 low. However, the price seems to be facing a strong resistance near the $0.0835 level. The 50% Fibonacci retracement level of the last decline from the $0.0905 high to $0.0764 low is acting as a resistance.
Moreover, there is a major bearish trend line forming with resistance near $0.0835 on the 4-hours chart. If there is an upside break above $0.0835, the price could test the $0.0850 resistance. The 61.8% Fibonacci retracement level of the last decline from the $0.0905 high to $0.0764 low is also near the $0.0851. Therefore, a successful close above $0.0835 and $0.0851 is needed for an upside acceleration.
If the price fails to climb above the $0.0835 and $0.0851 resistance levels, it could decline again. An initial support is near $0.0820 and $0.0800, below which the price is likely to revisit the $0.0764 swing low.

The chart indicates that ADA price is currently trading near a crucial resistance area at $0.0835. If the bulls succeed in clearing the $0.0835 and $0.0851 resistances, there could be a strong rise towards $0.0900 and $0.0920. Conversely, there could be a fresh decline below $0.0800. If there are more downsides, the price could even test the $0.0750 level.
Technical Indicators
4 hours MACD – The MACD for ADA/USD is currently losing momentum in the bullish zone.
4 hours RSI – The RSI for ADA/USD is still below the 50 level and is struggling to gain pace.
Key Support Levels – $0.0800 and $0.0750.
Key Resistance Levels – $0.0835 and $0.0851.


Leave a Reply
You must be logged in to post a comment.