- Bitcoin price extended gains above the main $10,000 resistance area against the US Dollar.
- The price even broke the $11,000 and $12,000 resistance levels and is currently up more than 20%.
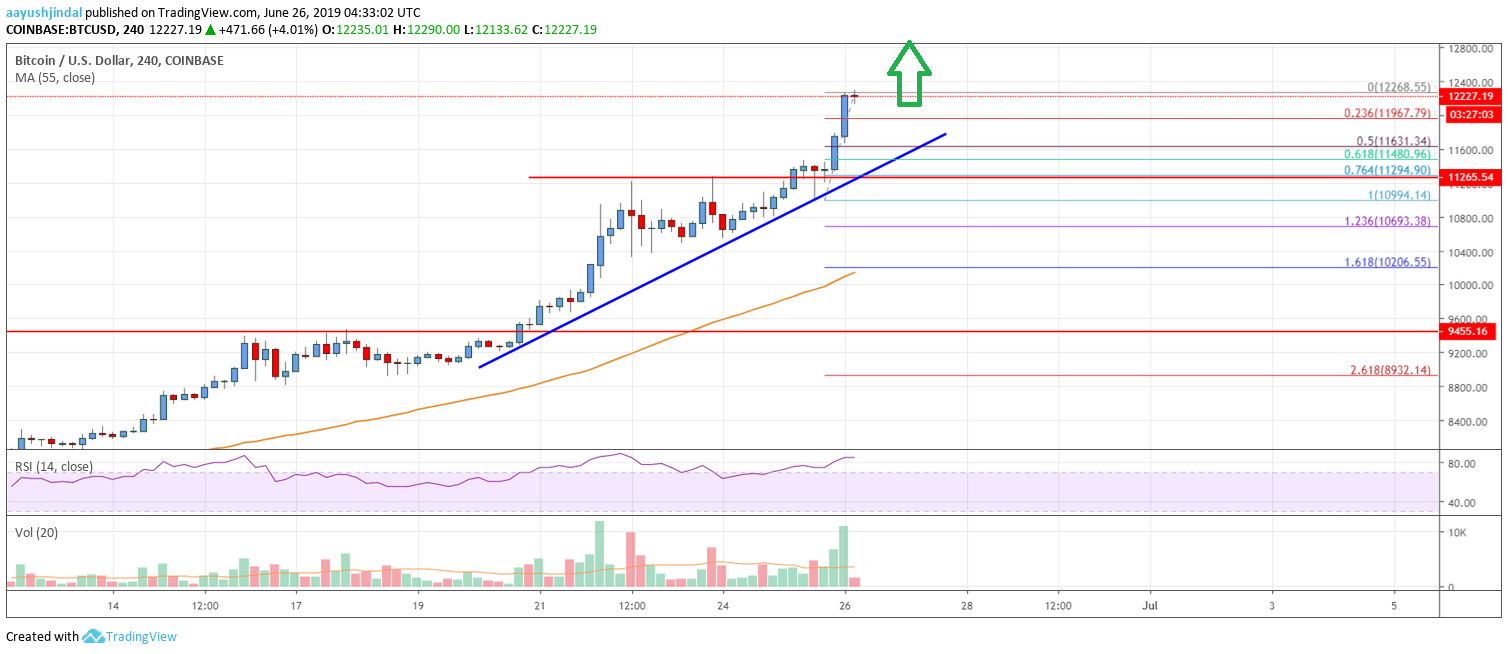
- There is a major bullish trend line forming with support near $11,630 on the 4-hours chart of the BTC/USD pair (data feed from Coinbase).
- The pair remains in a strong uptrend and it could accelerate gains above the $12,500 level.
Bitcoin price is surging above the $12,000 level against the US Dollar. BTC is showing a lot of positive signs and it could continue to surge in the near term towards $13,000.
Bitcoin Price Analysis
In the past few days, bitcoin price strengthened a lot above $10,000 against the US Dollar. The BTC/USD pair surged above the main $10,500 and $11,000 resistance levels. There was also a close above the $10,000 level and the 55 simple moving average (4-hours). It opened the doors for more gains and the price climbed above the $12,000 resistance. Finally, the price spiked above the $12,200 level and a new yearly high was formed at $12,268.
The price remains in a strong uptrend and it may even climb above the $12,500 level in the near term. An initial support on the downside is near the $12,000 level. The 23.6% Fib retracement level of the recent rally from the $10,994 low to $12,268 high is near $11,967 to act as a support. Moreover, there is a major bullish trend line forming with support near $11,630 on the 4-hours chart of the BTC/USD pair.
The trend line support holds the key near the $11,600 level. Moreover, the 50% Fib retracement level of the recent rally from the $10,994 low to $12,268 high is also near the $11,630 level. Therefore, if there is a downside correction, the price is likely to find support near $12,000 or $11,600. If there is a downside break, the price may test the $11,250 support area.

Looking at the chart, bitcoin price is clearly trading with a strong bullish bias above $11K and the 55 simple moving average (4-hours). The price action suggests chances of more gains above the $12,500 level. In the mentioned case, the price may even test the $13,000 resistance level. If there are more gains, the next stop for the bulls could be near the $13.6K level. Overall, the trend is very positive, calling for more upsides above $12,500.
Technical indicators
4 hour MACD – The MACD is gaining momentum in the bullish zone.
4 hour RSI (Relative Strength Index) – The RSI is currently well above the 60 level, with a bullish angle.
Key Support Levels – $12,000 and $11,600.
Key Resistance Levels – $12,500, $13,000 and $13,500.


Leave a Reply
You must be logged in to post a comment.