- Bitcoin price revisited the key $7,500 support area against the US Dollar, where the bulls emerged.
- The price recovered recently above $7,800, but it is facing a strong resistance near the $8,000 level.
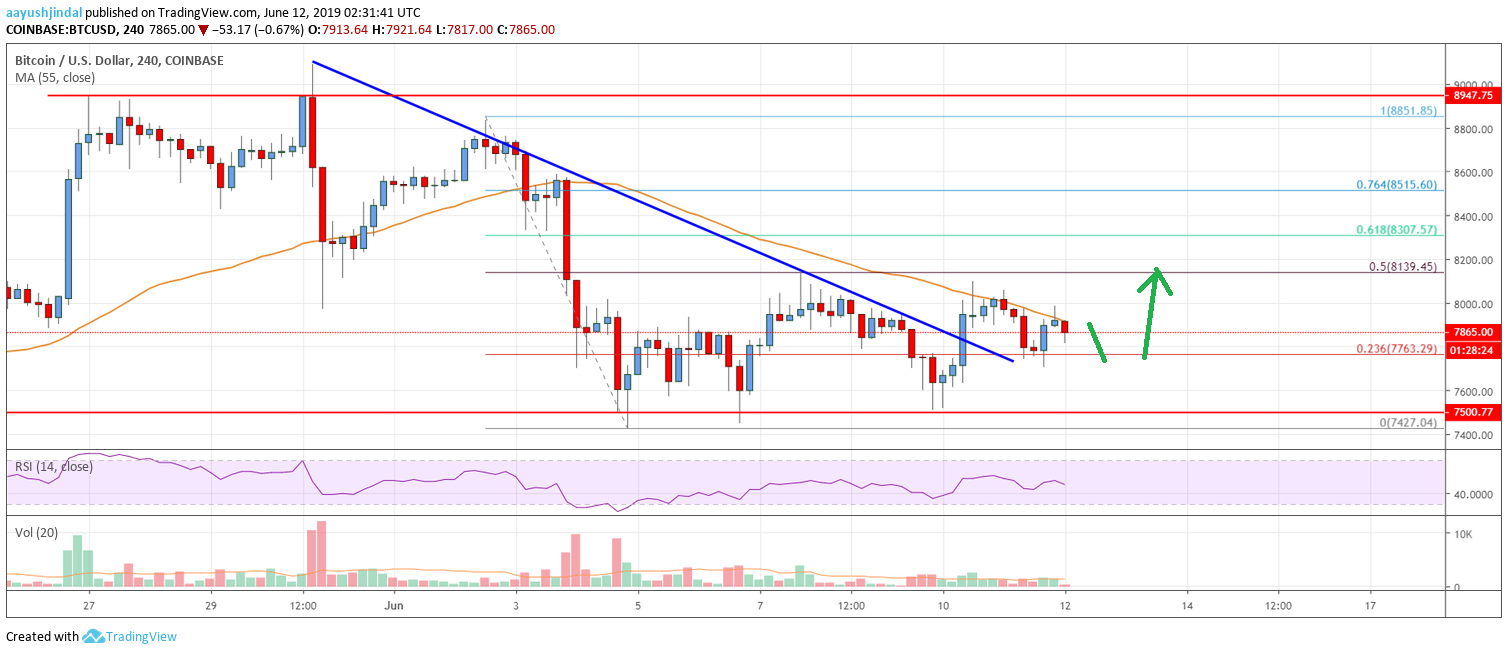
- There was a break above a major bearish trend line with resistance at $7,865 on the 4-hours chart of the BTC/USD pair (data feed from Coinbase).
- The pair is currently struggling to clear the $8,000 resistance and the 55 SMA (4-hours).
Bitcoin price is trading above the main $7,500 support area against the US Dollar. BTC is facing a strong resistance near $8,000, above which it could continue to rise in the near term.
Bitcoin Price Analysis
Recently, bitcoin price declined below the $8,200 and $8,000 support levels against the US Dollar. The BTC/USD pair even broke the $7,750 support area. There was a close below the $8,000 level and the 55 simple moving average (4-hours). It opened the doors for more losses and the price tested the main support area near the $7,500 level. A swing low was formed at $7,427 before the price started an upside correction.
It broke the $7,800 level and the 23.6% Fib retracement level of the downward move from the $8,850 swing high to $7,427 low. Moreover, there was a break above a major bearish trend line with resistance at $7,865 on the 4-hours chart of the BTC/USD pair. The pair even broke the $8,000 level and $8,100. However, the upward move failed to gain pace above $8,140. The 50% Fib retracement level of the downward move from the $8,850 swing high to $7,427 low also acted as a resistance.
It seems like the $8,000 level is acting as a strong resistance. Moreover, the 55 simple moving average (4-hours) is also preventing gains near $7,950. If there is a successful break above the 55 simple moving average (4-hours) and the $8,000 level, the price could continue to rise. Conversely, if the price continues to struggle near $8,000, there could be a fresh decline. An immediate support is at $7,760, below which the price could move back in a bearish zone. The main support is at $7,500, below which the price could move towards the $7,000 level.

Looking at the chart, bitcoin price is clearly struggling to clear the 55 simple moving average (4-hours) and $8,000. As long as there is no close above $8,000, the price might continue to struggle in the coming sessions.
Technical indicators
4 hour MACD – The MACD is losing momentum in the bullish zone.
4 hour RSI (Relative Strength Index) – The RSI is currently moving lower towards the 40 level, with a bearish angle.
Key Support Levels – $7,650 and $7,500.
Key Resistance Levels – $8,000, $8,150 and $8,300.


Leave a Reply
You must be logged in to post a comment.