- Bitcoin price rallied this week above the $8,800 and $8,900 levels against the US Dollar.
- The price formed a new yearly high at $8,928 and it is currently correcting lower.
- There is a crucial bullish trend line forming with support at $8,280 on the 4-hours chart of the BTC/USD pair (data feed from Coinbase).
- The pair remains well supported on dips near the $8,400, $8,280 and $8,130 levels.
Bitcoin price is trading in a strong uptrend above $8,280 and $8,400 against the US Dollar. BTC is likely to resume its upward move unless the bulls fail to defend the $8,000 support area.
Bitcoin Price Analysis
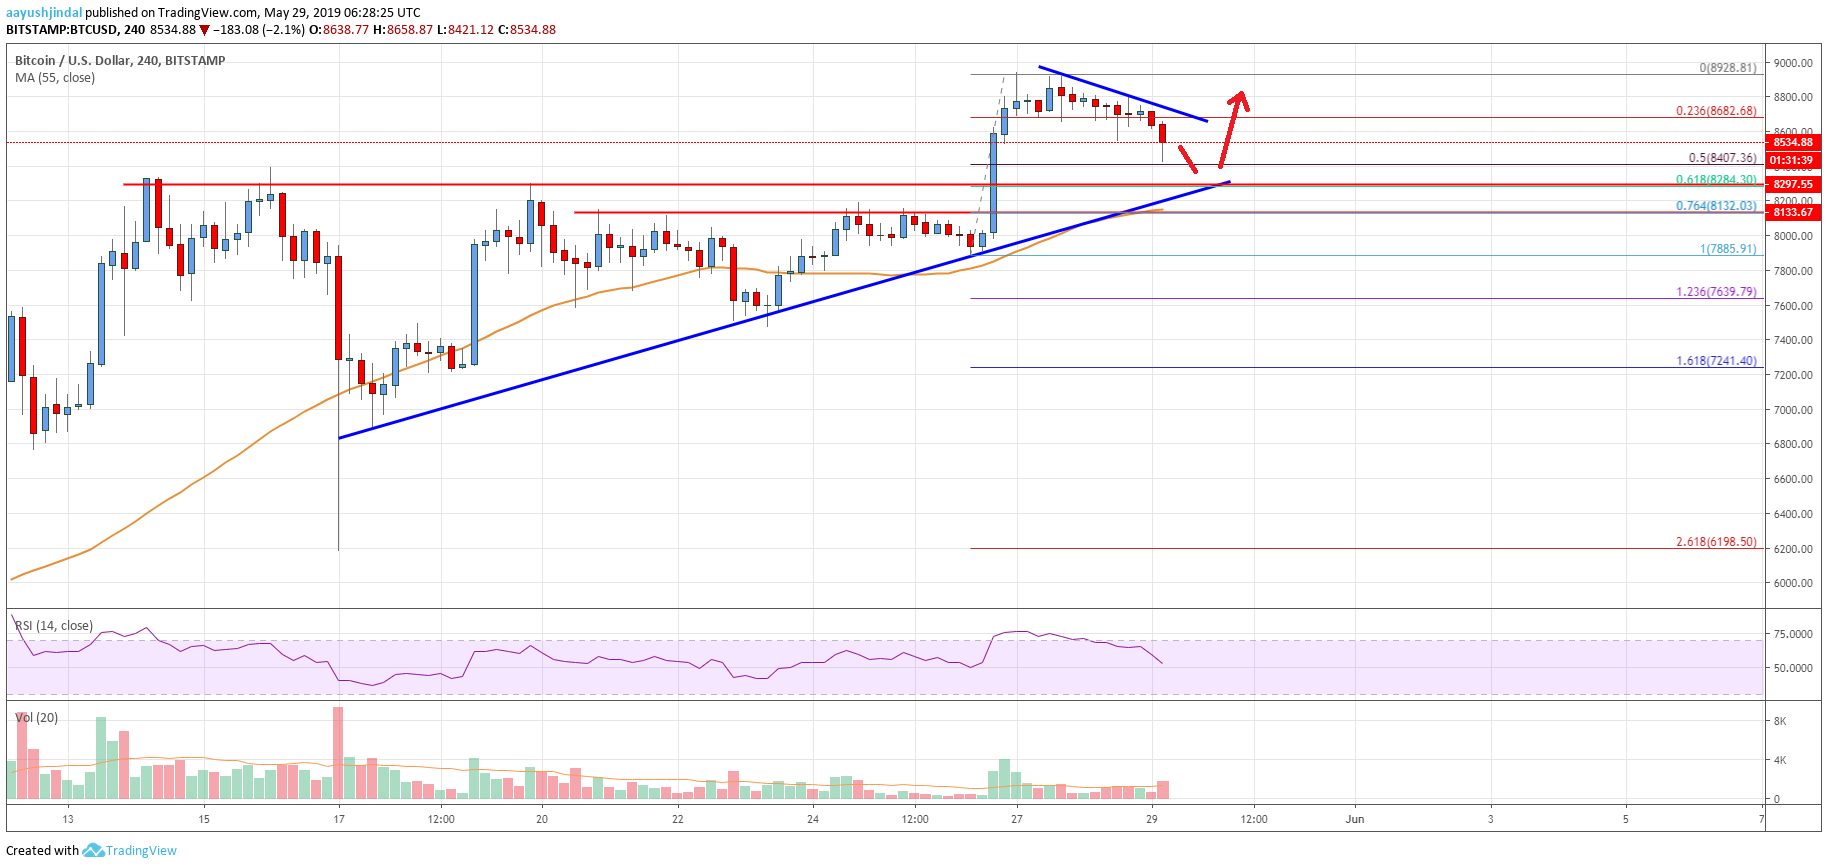
This week, bitcoin price started a strong upward move above the $8,280 and $8,300 resistances against the US Dollar. The BTC/USD pair gained bullish momentum above the $8,500 and $8,600 resistance levels. It even surged above $8,800 and settled well above the 55 simple moving average (4-hours). Finally, there was a break above the $8,900 level and the price formed a new yearly high at $8,928. Recently, it started a downside correction below the $8,650 support area.
There was a break below the 23.6% Fib retracement level of the last wave from the $7,885 low to $8,928 high. However, there are a few key supports near the $8,400 and $8,280 levels. An immediate support is close to the $8,400 level. It represents the 50% Fib retracement level of the last wave from the $7,885 low to $8,928 high. Moreover, there is a crucial bullish trend line forming with support at $8,280 on the 4-hours chart of the BTC/USD pair. If there is a downside break below the trend line, the next important support is near $8,130. The 55 simple moving average (4-hours) is also near the $8,100 area.
The last line of defense could be $8,000, below which the price might move into a short term downtrend. On the upside, an initial resistance is near the $8,680 level and a bearish trend line. A successful break above the $8,680 and $8,700 levels is likely to open the doors for more gains. The next key resistances are near $8,740 and $8,800.

Looking at the chart, bitcoin price is currently correcting lower below $8,700 and $8,600. Having said that, BTC remains well supported near the $8,400, $8,280 and $8,130 levels. Only a daily close below $8,000 could negate the current bullish view and push the price towards $7,500.
Technical indicators
4 hour MACD – The MACD is losing momentum in the bullish zone.
4 hour RSI (Relative Strength Index) – The RSI is currently moving lower towards the 50 level, with a bearish angle.
Key Support Levels – $8,280 and $8,130.
Key Resistance Levels – $8,680, $8,740 and $8,800.


Leave a Reply
You must be logged in to post a comment.