- ADA price moved higher this week above the $0.0900 resistance area against the US Dollar.
- The price struggled to clear the $0.0935 level and recently corrected below $0.0900.
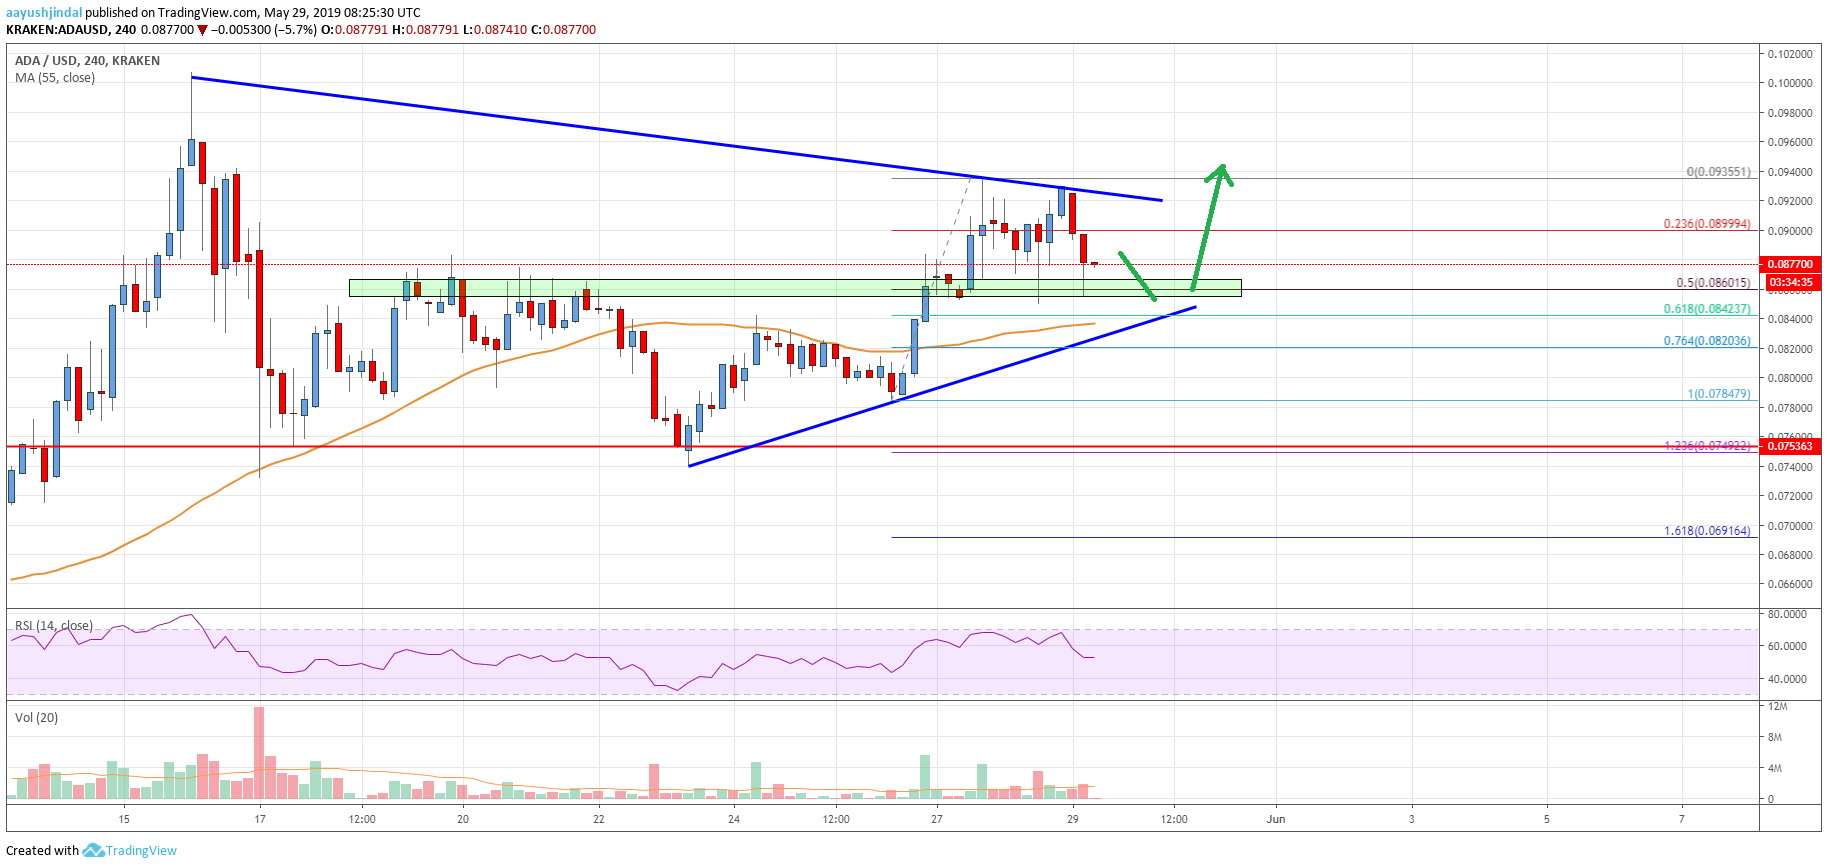
- There is a breakout pattern forming with resistance near $0.0920 on the 4-hours chart (data feed via Kraken).
- The price is likely to climb above $0.0920 and $0.0935 as long as it is trading above the $0.0840 support.
Cardano price is currently trading in a positive zone against the US Dollar, but struggling vs bitcoin. ADA could start a fresh increase if it clears the $0.0920 and $0.0935 resistances.
Cardano Price Analysis
After forming a support base near $0.0750, cardano price started an upward move against the US Dollar. The ADA/USD pair broke the $0.0800 resistance level to move into a positive zone. There was a close above the $0.0840 pivot level and the 55 simple moving average (4-hours). Finally, the price climbed above the $0.0880 and $0.0900 levels. A new weekly high was formed near the $0.0935 and the price recently started a downside correction.
It traded below the $0.0900 level and the 23.6% Fibonacci retracement level of the last wave from the $0.0784 low to $0.0935 high. However, the price tested a crucial support area near the $0.0860 level, which was a resistance earlier. Moreover, the 50% Fibonacci retracement level of the last wave from the $0.0784 low to $0.0935 high is currently acting as a support. More importantly, there is a breakout pattern forming with resistance near $0.0920 on the 4-hours chart.
The triangle support is aligned with the 55 simple moving average (4-hours) near $0.0825. Besides, the 76.4% Fibonacci retracement level of the last wave from the $0.0784 low to $0.0935 high is also near the $0.0820 level. Therefore, the $0.0840 and $0.0820 supports are likely to play an important role for the bulls. If there is a clear break below $0.0820, the price might start a strong downward move. On the upside, the main hurdles for the bulls are near $0.0920 and $0.0935.

The chart indicates that ADA price is currently trading above a few important supports near $0.0860. As long as there is no downside break, the price is likely to climb above $0.0920. However, the bulls need to gain strength above $0.0935 to start a fresh increase. The next key resistance is at $0.0950, above which the price will most likely break $0.1000.
Technical Indicators
4 hours MACD – The MACD for ADA/USD is slowly losing momentum in the bullish zone.
4 hours RSI – The RSI for ADA/USD declined recently, but it is still above the 50 level with a flat structure.
Key Support Levels – $0.0860 and $0.0840.
Key Resistance Levels – $0.0920 and $0.0935.


Leave a Reply
You must be logged in to post a comment.