- ADA price surged towards the $0.1000 level and recently corrected below $0.0900 against the US Dollar.
- The price traded below the $0.0850 support level, tested $0.0734 and recently moved higher.
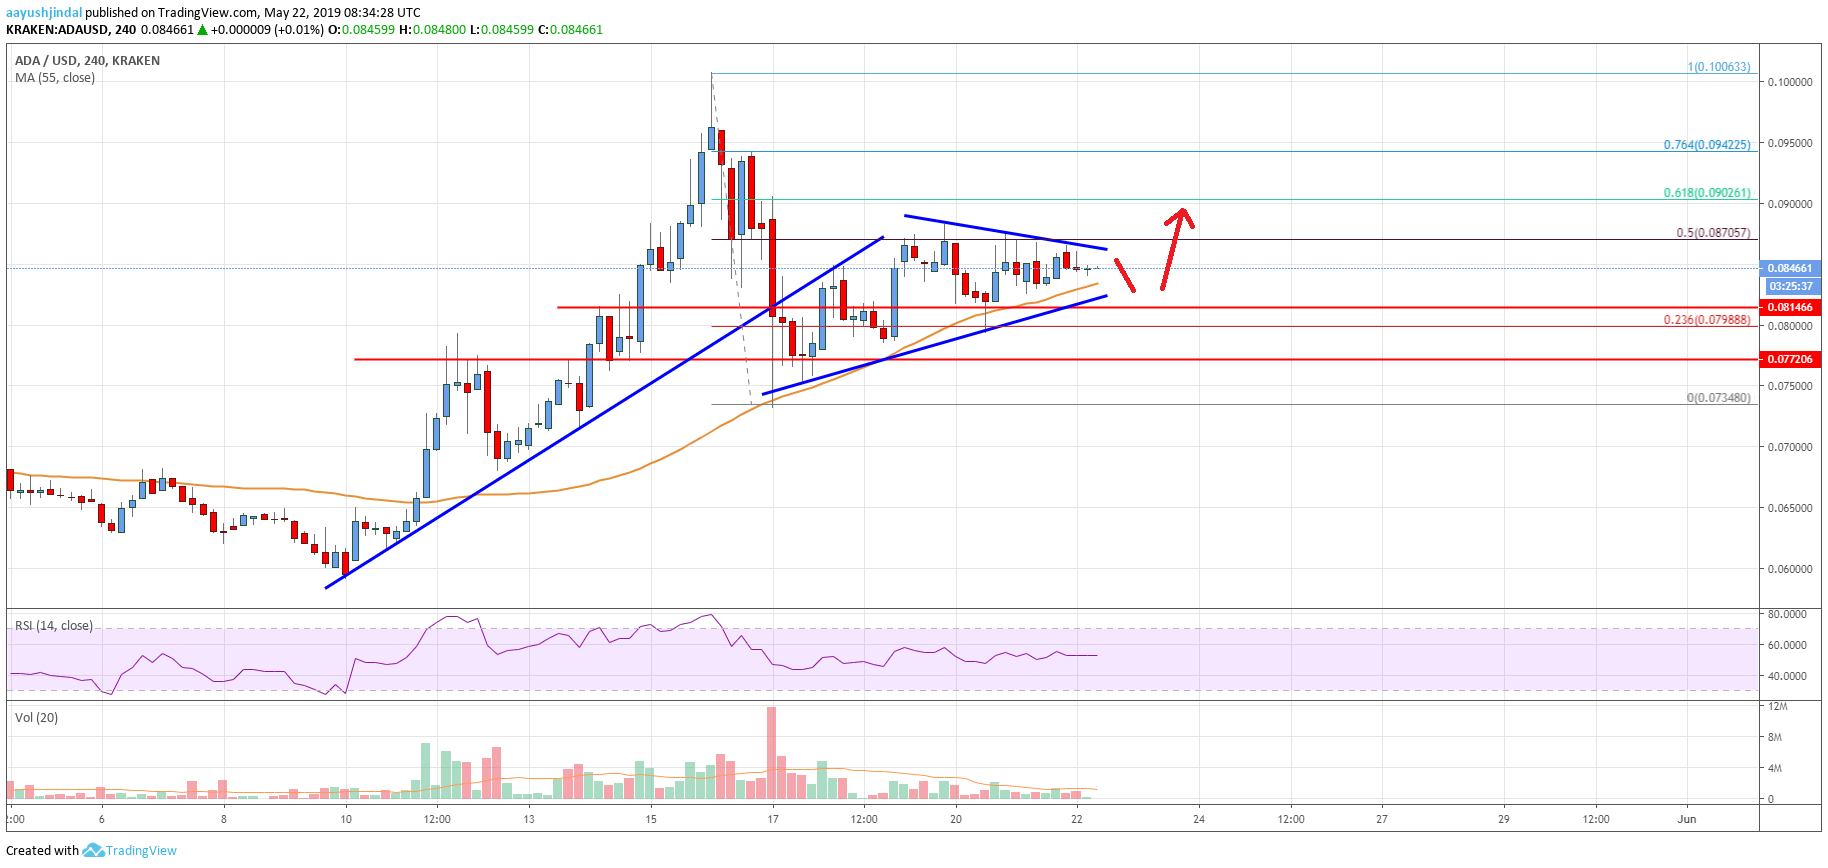
- There is a key contracting triangle forming with resistance near $0.0865 on the 4-hours chart (data feed via Kraken).
- The price could start a strong upward move once it clears the $0.0870 and $0.0880 resistances.
Cardano price is slowly moving higher and is trading above $0.0800 against the US Dollar, but struggling vs bitcoin. ADA is likely to recover above $0.0950 as long as it is holding $0.0800
Cardano Price Analysis
This past week, there was a steady rise in cardano price above the $0.0800 resistance against the US Dollar. The ADA/USD pair broke the $0.0850 resistance and settled above the 55 simple moving average (4-hours). The upward move was positive as the price even broke the $0.0900 and $0.0950 resistance levels. A new monthly high was formed at $0.1006 and later the price started a sharp downside correction. It traded below the $0.0900 support level.
However, the $0.0735 level acted as a support along with the 55 simple moving average (4-hours). A swing low was formed at $0.0734 and the price corrected above $0.0800. There was also a break above the 23.6% Fibonacci retracement level of the last decline from the $0.1006 high to $0.0734 low. The price traded above $0.0850, but struggled to clear $0.0880. The 50% Fibonacci retracement level of the last decline from the $0.1006 high to $0.0734 low is also acting as a resistance.
Moreover, there is a key contracting triangle forming with resistance near $0.0865 on the 4-hours chart. A clear break above the $0.0870 and $0.0880 resistance levels may open the doors for more gains. The next key resistance is $0.0942 and the 76% Fibonacci retracement level of the last decline from the $0.1006 high to $0.0734 low. Above $0.0950, the price is likely to break the $0.1000 barrier. Conversely, if there is a downside break below the $0.0815 and $0.0800 support, there could be a sharp downside extension.

The chart indicates that ADA price seems to be preparing for the next move either above $0.0870 or below $0.0800. The price action is positive, but it won’t be easy for the bulls to gain strength above $0.0870 and $0.0880. On the downside, a break below $0.0800 might push the price towards $0.0750 or $0.0712.
Technical Indicators
4 hours MACD – The MACD for ADA/USD is slowly moving in the bullish zone.
4 hours RSI – The RSI for ADA/USD is currently just above the 50 level, with a flat structure.
Key Support Levels – $0.0815 and $0.0800.
Key Resistance Levels – $0.0880 and $0.0900.


Leave a Reply
You must be logged in to post a comment.