- Bitcoin price traded towards the $8,350 resistance level and recently corrected lower against the US Dollar.
- The price is holding the key $7,640 and $7,600 support levels and it could bounce back.
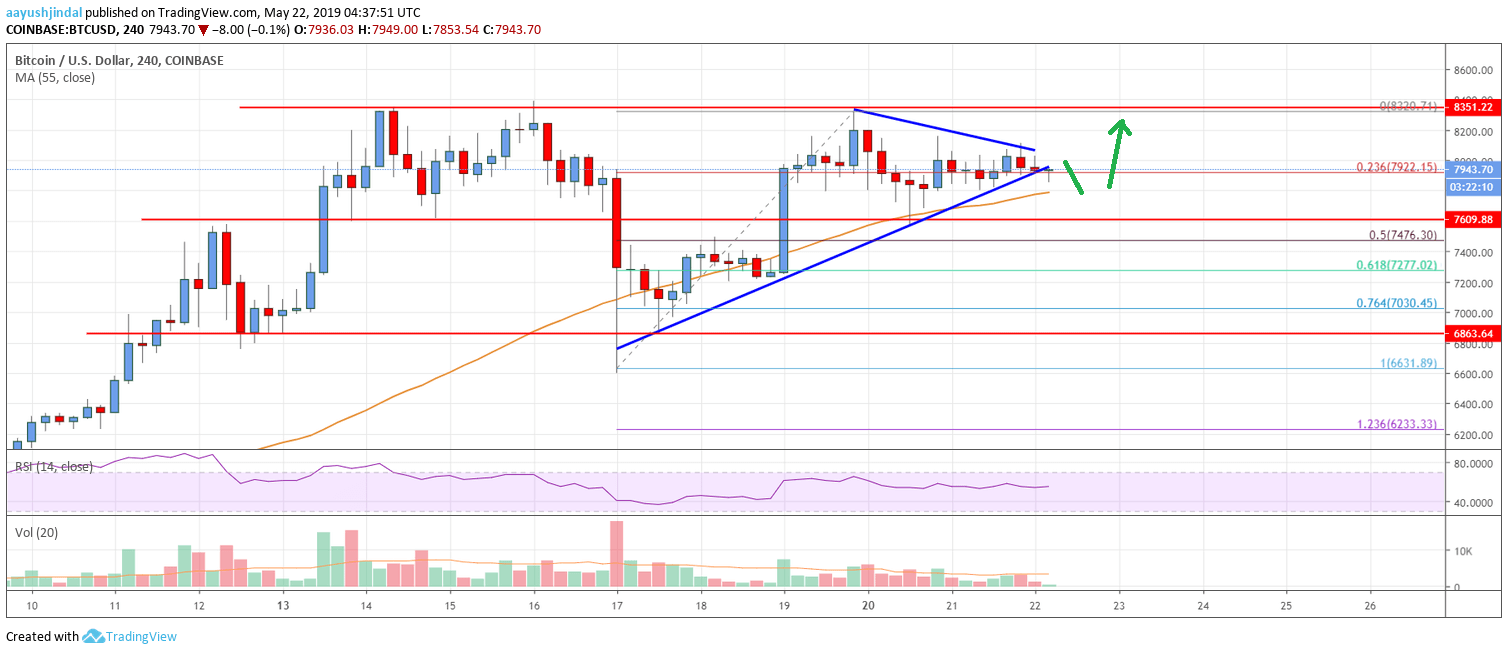
- There is a crucial contracting triangle forming with support near $7,920 on the 4-hours chart of the BTC/USD pair (data feed from Coinbase).
- The pair remains well supported on dips near the $7,840, $7,640 and $7,600 levels.
Bitcoin price is currently correcting gains below the $8,000 support against the US Dollar. BTC is likely to climb higher in the near term as long as the $7,640 support area.
Bitcoin Price Analysis
This week, bitcoin price gained a strong bullish momentum above the $7,500 barrier against the US Dollar. The upward move was strong, as the price settled above the $7,800 level and the 55 simple moving average (4-hours). The BTC/USD pair climbed above the $8,000 and $8,200 resistance levels. It once again tested the $8,350 resistance area, where sellers emerged. A swing high was formed near $8,320 and recently the price started a downside correction.
There was a break below the $8,000 support and the 23.6% Fib retracement level of the last wave from the $6,631 low to $8,320 high. Moreover, there was a spike below the $7,800 level and the price tested the $7,600 support area. The 50% Fib retracement level of the last wave from the $6,631 low to $8,320 high also acted as a strong support. More importantly, the 55 simple moving average (4-hours) also acted as a support above $7,600. At the moment, the price is attempting a close below a crucial contracting triangle with support near $7,920 on the 4-hours chart.
If there is a proper close below the $7,900 support, there are chances of more losses. An immediate support is at $7,840 and the 55 SMA. Any further losses are likely to push the price towards the main $7,640 and $7,600 support levels. On the upside, the triangle resistance is near the $8,000 level, above which there are chances of more gains. The next key resistance is near the $8,180. Having said that, the bulls need to clear the $8,350 barrier for a fresh rally towards the $8,500 and $8,800 levels.

Looking at the chart, bitcoin price is clearly facing a strong barrier near the $8,350 level. If the price continues to struggle near the $8,350, there are chances of a sharp drop in the short term.
Technical indicators
4 hour MACD – The MACD is losing momentum in the bullish zone.
4 hour RSI (Relative Strength Index) – The RSI is currently above the 50 level, with a flat structure.
Key Support Levels – $7,800 and $7,600.
Key Resistance Levels – $8,000, $8,200 and $8,350.


Leave a Reply
You must be logged in to post a comment.