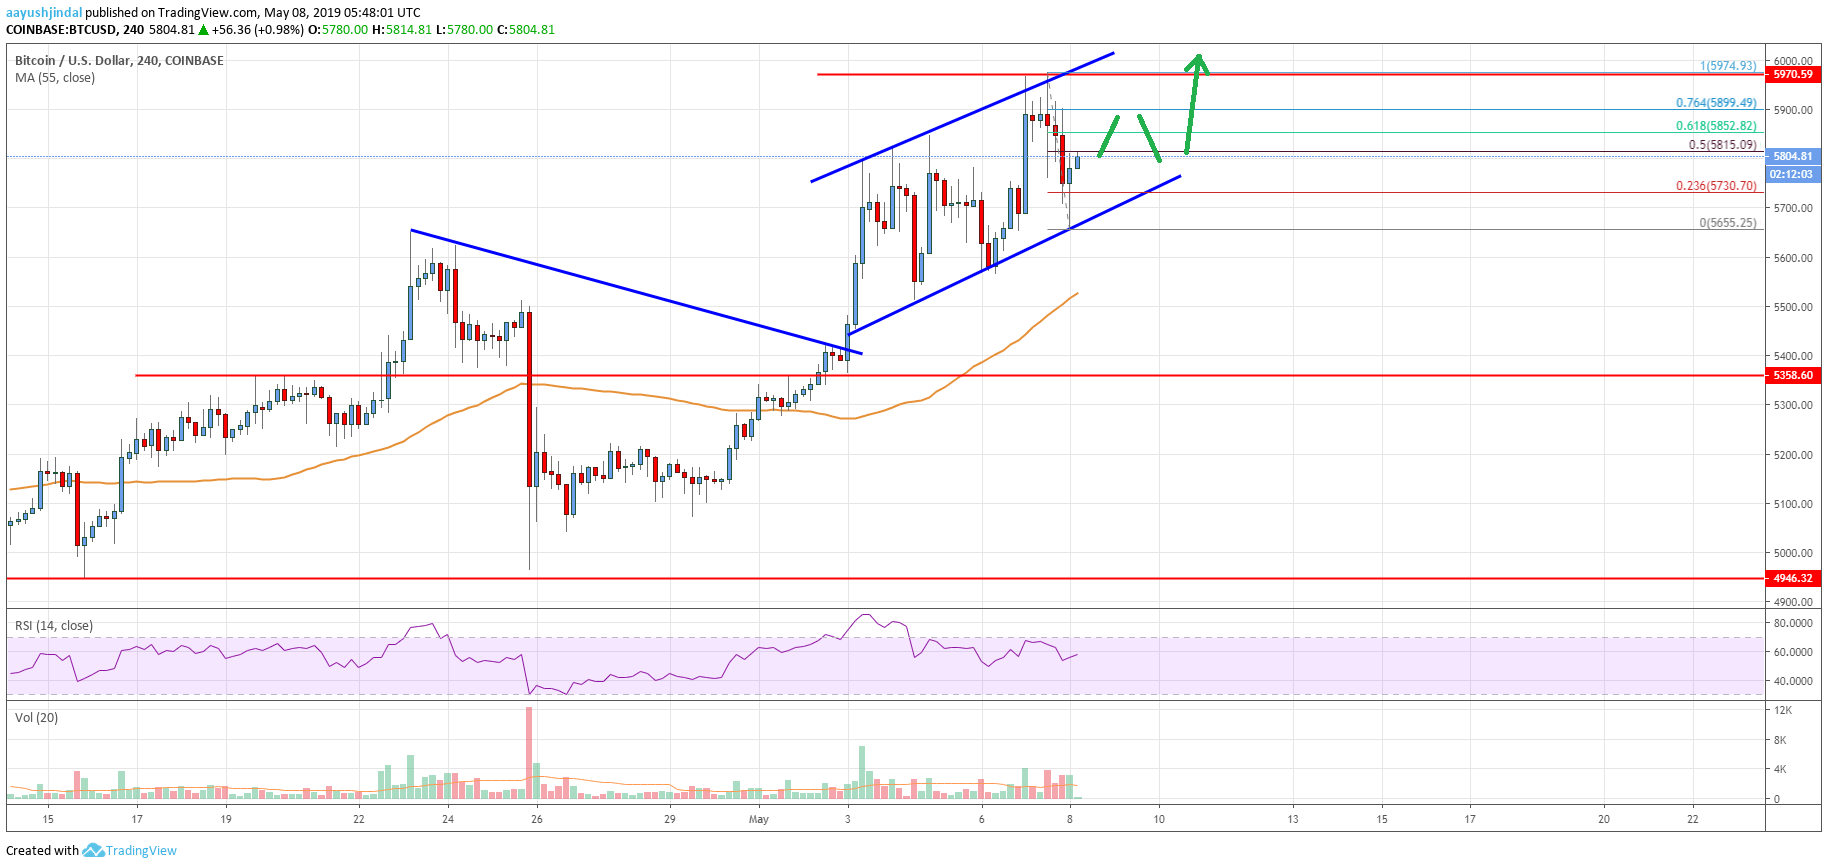
- Bitcoin price rallied significantly and traded towards the $6,000 level against the US Dollar.
- The price traded as high as $5,974 and it recently corrected lower towards $5,655.
- There is a major ascending channel in place with support at $5,730 on the 4-hours chart of the BTC/USD pair (data feed from Coinbase).
- The pair remains in a strong uptrend and it could break $6,000 as long as the $5,700 support is intact.
Bitcoin price started a strong rally above $5,600 and $5,800 against the US Dollar. BTC traded close to the $6,000 barrier and it is currently correcting gains.
Bitcoin Price Analysis
This week, bitcoin price started a steady rise above the $5,400 and $5,500 resistances against the US Dollar. The BTC/USD pair broke the key $5,700 resistance level and settled above the 55 simple moving average (4-hours). The uptrend was such that the price even broke $5,800 and traded close to the $6,000 level. A new 2019 high was formed at $5,974 on Coinbase and the price recently corrected lower. It traded below the $5,850 and $5,780 support levels.
There was even a spike below $5,700, but the price remained well above the 55 simple moving average (4-hours). A swing low was formed at $5,655 and the price is currently climbing higher. It is testing the $5,800 level, and the 50% Fib retracement level of the last decline from the $5,974 high to $5,655 low. On the upside, an immediate resistance is near the $5,850 and $5,855 levels. Besides, the 61.8% Fib retracement level of the last decline from the $5,974 high to $5,655 low is also near the $5,852 level to act as a resistance. Therefore, a clear break above the $5,855 resistance may push the price towards the $5,950 and $6,000 levels.
On the downside, there are many supports near $5,730 and $5,700. More importantly, there is a major ascending channel in place with support at $5,730 on the 4-hours chart of the BTC/USD pair. If there is a fresh decline, the pair is likely to find a strong buying interest near $5,730 and $5,700. A convincing close below the channel support and $5,700 might start a strong downside correction.

Looking at the chart, bitcoin price is in a clear uptrend above $5,700. It could soon make an attempt to surpass the main $6,000 resistance level. If it continues to struggle near $5,850 and $5,950, there is a risk of a drop towards $5,500 and the 55 SMA.
Technical indicators
4 hour MACD – The MACD is placed nicely in the bullish zone.
4 hour RSI (Relative Strength Index) – The RSI is currently moving higher towards the 60 level.
Key Support Levels – $5,730 and $5,700.
Key Resistance Levels – $5,850, $5,950 and $6,000.


Leave a Reply
You must be logged in to post a comment.