- ADA price remained in a major downtrend and recently tested the $0.0626 support against the US Dollar.
- The price is currently struggling to hold $0.0626 and facing many hurdles near $0.0660.
- There is a major bearish trend line forming with resistance at $0.0666 on the 4-hours chart (data feed via Kraken).
- The price could either decline heavily below $0.0600 or it could stage a comeback above $0.0660.
Cardano price extended losses and declined heavily against the US Dollar and bitcoin. ADA is currently trading near a crucial support at $0.0626 and remains at a risk of more losses.
Cardano Price Analysis
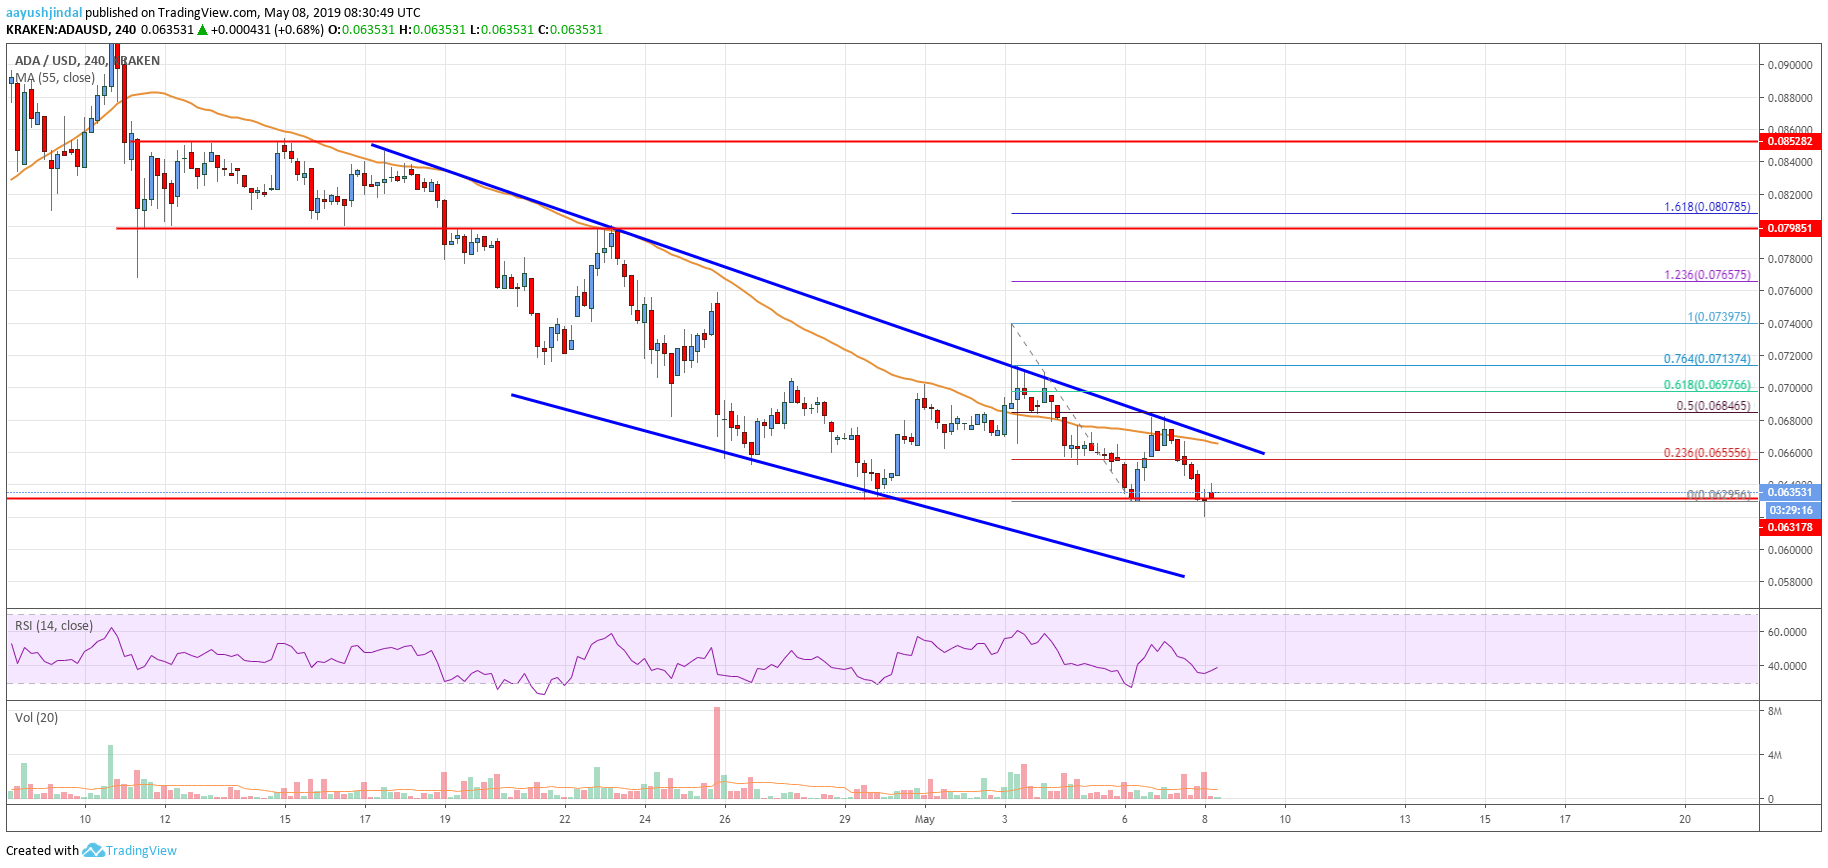
In the past few days, there was a steady decline in cardano price below the $0.0700 support against the US Dollar. The ADA/USD pair retested the $0.0626 and $0.0628 support levels recently. It started a decent upward move above the $0.0650 and the 23.6% Fibonacci retracement level of the drop from the $0.0739 high to $0.0629 low. However, the upward move was capped by the $0.0685 level and the 55 simple moving average (4-hours).
The price also failed to clear the 50% Fibonacci retracement level of the drop from the $0.0739 high to $0.0629 low. More importantly, there is a major bearish trend line forming with resistance at $0.0666 on the 4-hours chart. As a result, the pair declined below $0.0650 and retested the key $0.0626 and $0.0628 support levels. It seems like the bulls are clearly struggling to hold the $0.0626 and $0.0628 support levels. If there is a downside break, the price may extend losses below the $0.0600 support.
On the upside, an initial resistance is near the $0.0650 level. However, the main resistance is near $0.0660, the bearish trend line, and the 55 simple moving average (4-hours). A successful close above the trend line is must to start a decent rebound. The next key resistances are near $0.0680 and $0.0700. Besides, if there is a daily close above $0.0700, the price could start a strong rally towards the $0.0850 and $0.0880 levels.

The chart indicates that ADA price is clearly trading near a crucial juncture at $0.0626. If the bulls fail to push the price higher, there could be additional losses below $0.0610 and $0.0600. There is also a connecting support trend line forming, with could act as a buy zone near $0.0580. Conversely, if there is a decent rebound above $0.0650 and $0.0660, the price might move back in a positive zone.
Technical Indicators
4 hours MACD – The MACD for ADA/USD is currently placed heavily in the bearish zone.
4 hours RSI – The RSI for ADA/USD is slowly recovering, but it is still below 45 and 50.
Key Support Levels – $0.0626 and $0.0600.
Key Resistance Levels – $0.0650 and $0.0660.


Leave a Reply
You must be logged in to post a comment.