- Bitcoin price started a fresh increase above the $11,300 resistance against the US Dollar.
- The price gained more than 15% this week and recently broke the $13,000 resistance area.
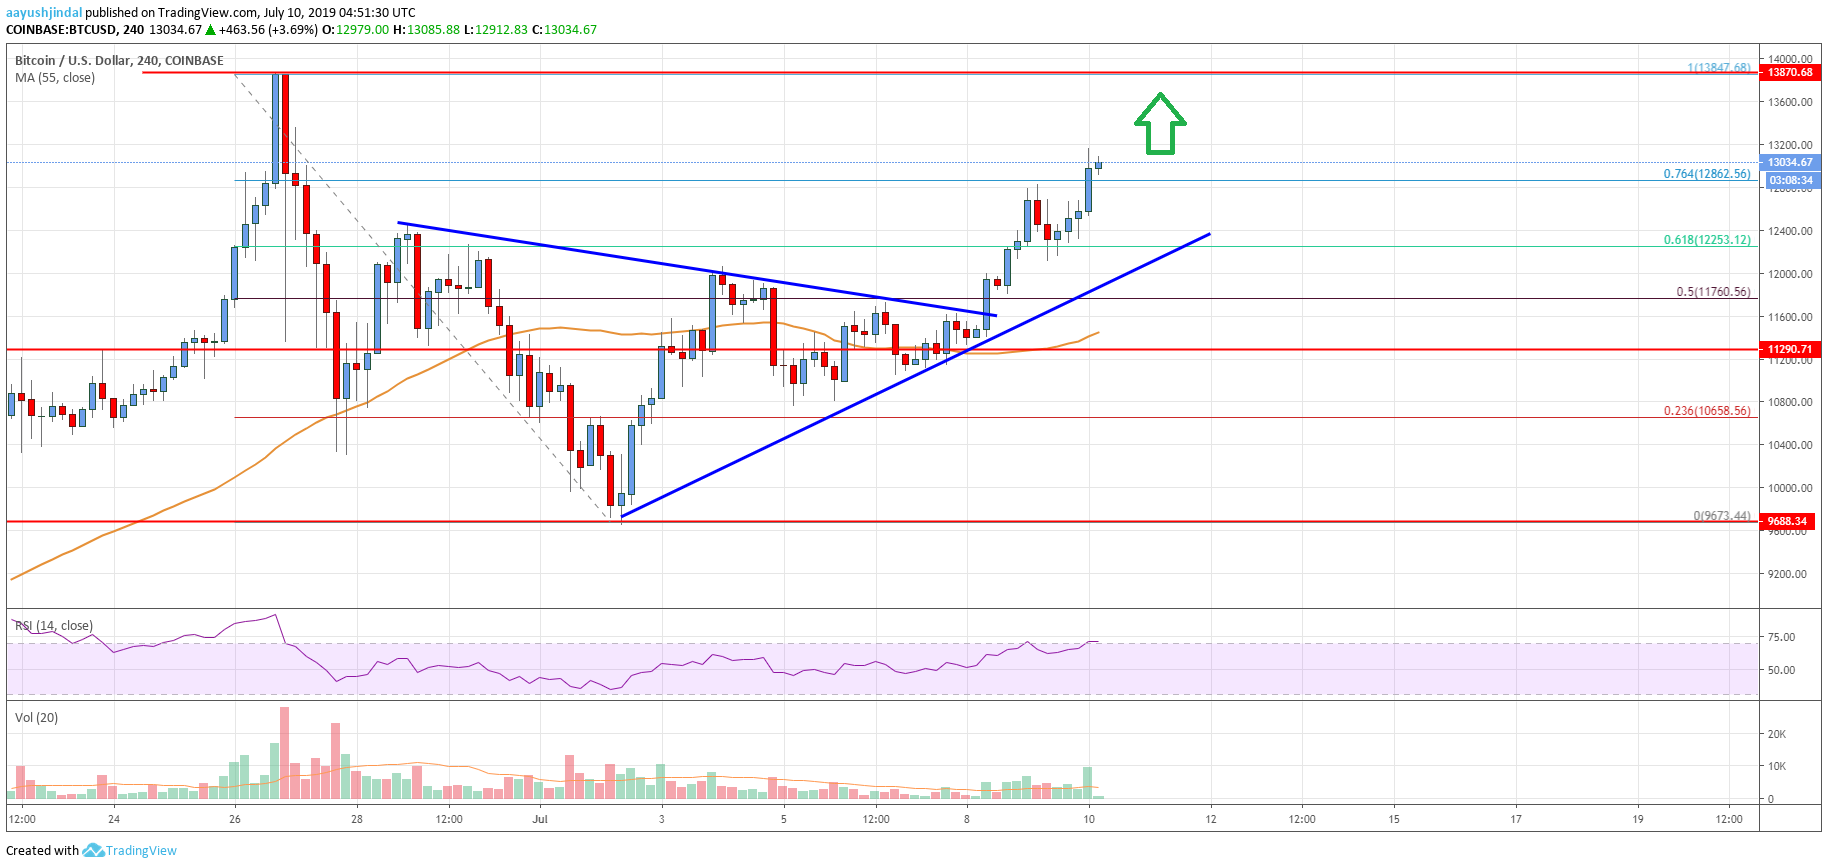
- There is a major bullish trend line in place with support near $12,200 on the 4-hours chart of the BTC/USD pair (data feed from Coinbase).
- The pair is likely to continue higher towards the $13,800 and $14,000 resistances in the near term.
Bitcoin price is currently trading nicely with a bullish angle above $12,200 against the US Dollar. BTC could accelerate gains and it may even test the $14,000 level.
Bitcoin Price Analysis
After a successful close above the $10,000 level, bitcoin price started a steady rise against the US Dollar. The BTC/USD pair started a fresh increase above the $11,000 and $11,300 resistance levels. Moreover, there was a close above the $11,500 level and the 55 simple moving average (4-hours). The price even surpassed the 50% Fib retracement level of the downward move from the $13,847 high to $9,670 swing low.
It opened the doors for more gains above the $12,000 and $12,500 resistance levels. Finally, the price broke the $13,000 resistance and the 61.8% Fib retracement level of the downward move from the $13,847 high to $9,670 swing low. Today, the price climbed above the $13,000 level to enter a significant uptrend and open the doors for more gains.
It is trading nicely above $13,000 and the 76% Fib retracement level of the downward move from the $13,847 high to $9,670 swing low. Therefore, there are chances of more upsides above $13,250 and $13,500 in the near term. In the mentioned case, the price may even test the last swing high near the $13,847 level. The main hurdle for the bulls could be near the $14,000 level.
On the downside, an immediate support is near the $12,650 level. Moreover, there is a major bullish trend line in place with support near $12,200 on the 4-hours chart of the BTC/USD pair. If there is a downside break below the trend line and $12,200, the price could correct lower towards the $11,300 support or the 55 simple moving average (4-hours).

Looking at the chart, bitcoin price is trading with a strong bullish bias above the $12,500 level. The current price action suggests high chances of a strong rise towards the $13,850 and $14,000 levels in the near term.
Technical indicators
4 hour MACD – The MACD is gaining momentum in the bullish zone.
4 hour RSI (Relative Strength Index) – The RSI is currently well above the 60 level, with a bullish angle.
Key Support Levels – $12,200 and $11,300.
Key Resistance Levels – $13,800, $14,000 and $14,200.


Leave a Reply
You must be logged in to post a comment.