- ADA price remained supported above $0.0520 and slowly recovered higher against the US Dollar.
- The price is currently trading above $0.0580 and it seems to be preparing for the next break.
- There is a major contracting triangle forming with resistance near $0.0620 on the 4-hours chart (data feed via Kraken).
- The price could either surge above $0.0620 and $0.0650 or it might decline back towards $0.0520.
Cardano price is trading in a contracting range against the US Dollar and bitcoin. ADA price could start a strong upward move if there is a break above $0.0620 and $0.0650.
Cardano Price Analysis
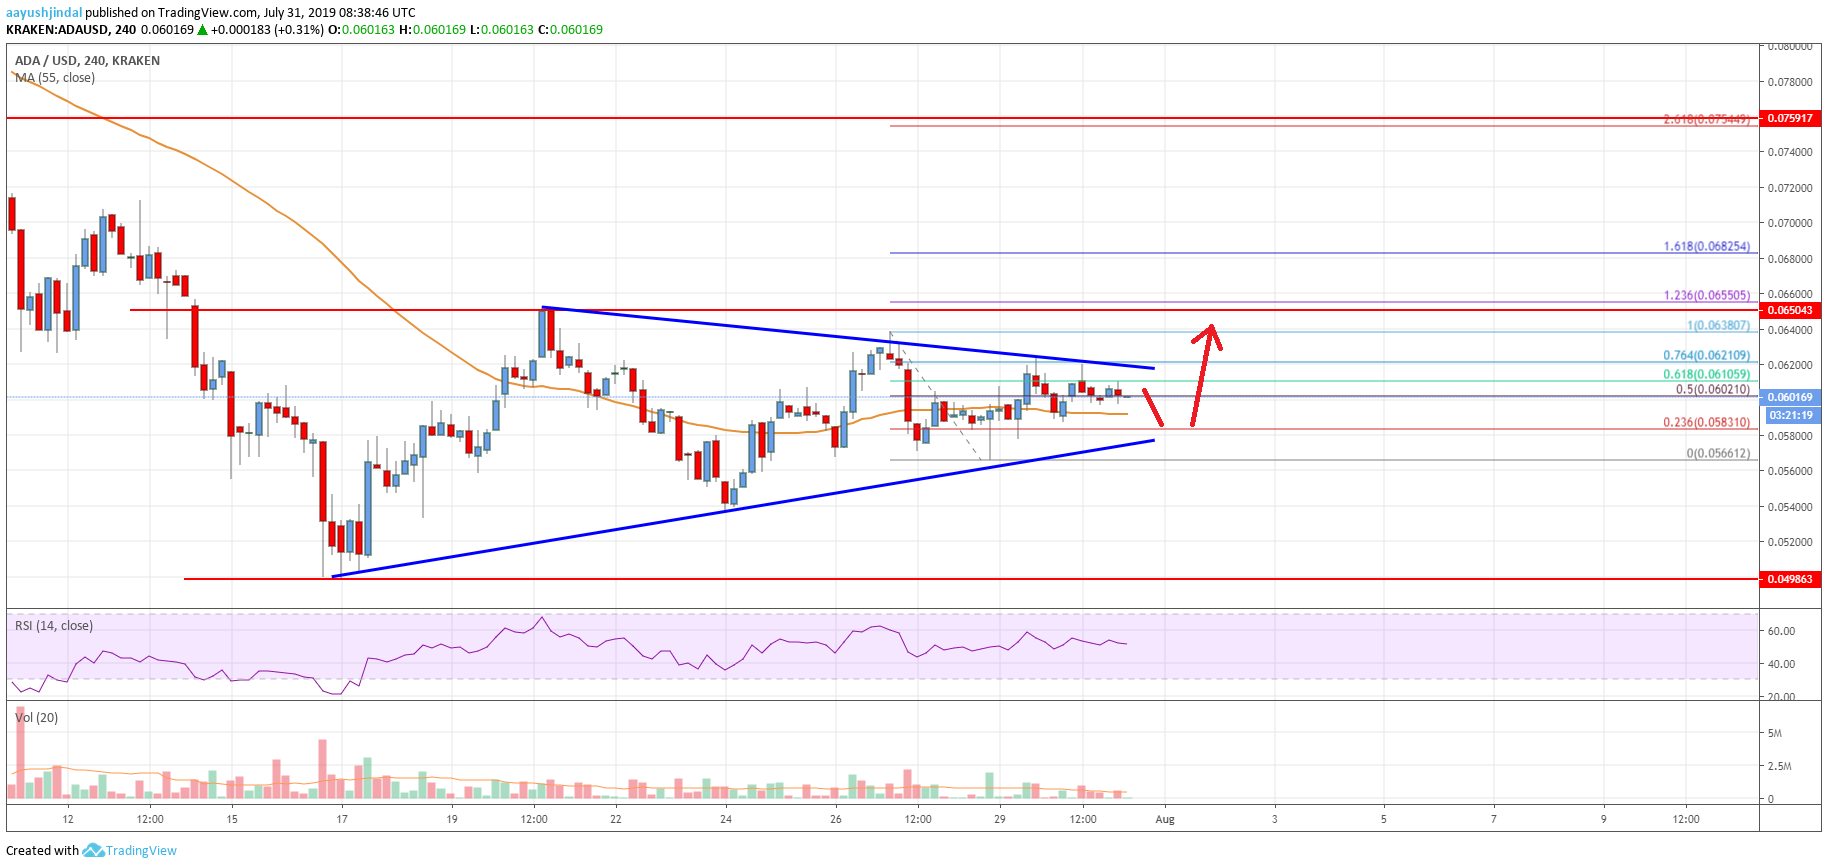
After trading as low as $0.0505, cardano price started a decent recovery against the US Dollar. The ADA/USD pair formed a support base near the $0.0520 and $0.0540 levels. Moreover, there was a break above the $0.0550 and $0.0565 resistance levels. Finally, there was a break above the $0.0600 level and the 55 simple moving average (4-hours). The price spiked towards the $0.0640 level and a swing high was formed near $0.0638.
Recently, the price corrected lower below $0.0600 and traded as low as $0.0566. It is currently trading in a contracting range above $0.0580 and recently climbed above the 50% Fibonacci retracement level of the last slide from the $0.0638 high to $0.0566 low. However, it seems like the bulls are struggling to gain momentum above the $0.0610 and $0.0620 levels.
The 76.4% Fibonacci retracement level of the last slide from the $0.0638 high to $0.0566 low also acted as a resistance. More importantly, there is a major contracting triangle forming with resistance near $0.0620 on the 4-hours chart. If there is an upside break above the $0.0620 resistance, the next hurdle is near the $0.0650 level. If there is a clear break above $0.0650, the price could continue to rise towards $0.0700 and $0.0800.
Conversely, if there is a downside break below $0.0580, the price could resume its decline. An immediate support below $0.0580 is near $0.0565. If there are more losses, the price may perhaps revisit the $0.0540 support level.

The chart indicates that ADA price is trading with a minor bullish angle above $0.0580 and is preparing for the next major break. If the bulls succeed in gaining traction above $0.0620 and $0.0650, there could be sharp gains in the near term. If not, the price could decline back towards $0.0540 or even $0.0510.
Technical Indicators
4 hours MACD – The MACD for ADA/USD is currently losing momentum in the bullish zone.
4 hours RSI – The RSI for ADA/USD is currently above the 50 level, with a flat structure
Key Support Levels – $0.0580 and $0.0540.
Key Resistance Levels – $0.0620 and $0.0650.


Leave a Reply
You must be logged in to post a comment.