- ADA price started a fresh decline after it failed to break the $0.0650 resistance against the US Dollar.
- The price broke the $0.0605 support level to move into a bearish zone.
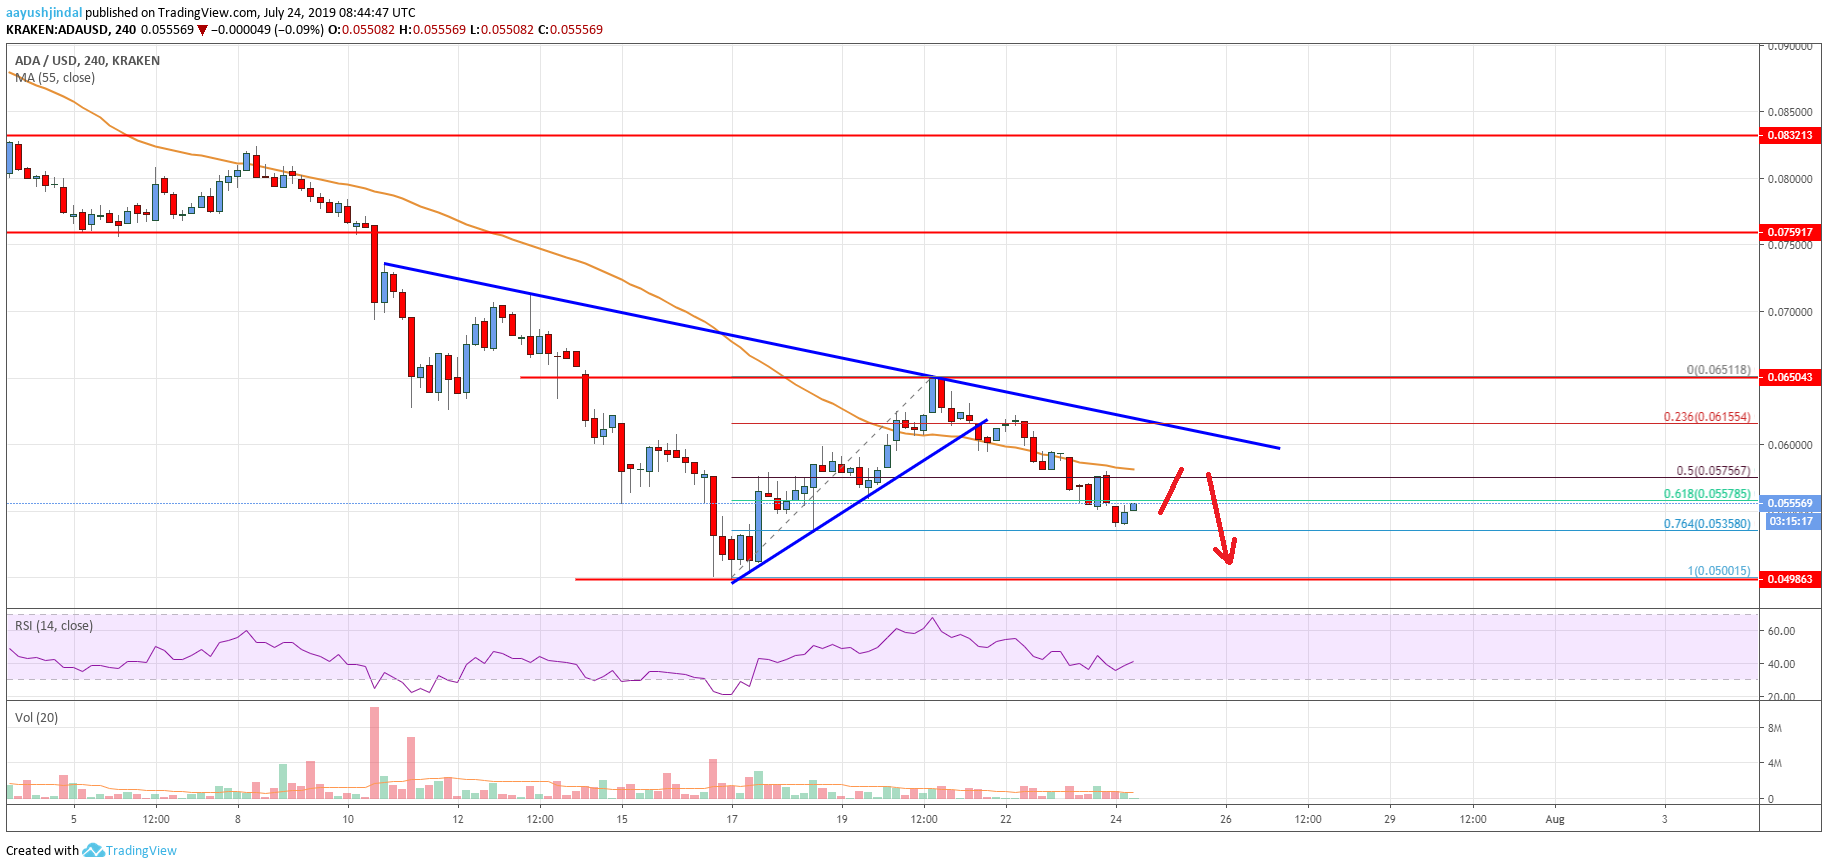
- There is a key bearish trend line forming with resistance near $0.0602 on the 4-hours chart (data feed via Kraken).
- The price could correct higher, but upsides are likely to remain capped near $0.0600.
Cardano price is gaining bearish momentum against the US Dollar and bitcoin. ADA price remains at a risk of more losses below $0.0540 and $0.0505 in the near term.
Cardano Price Analysis
After a strong decline, cardano price found support near the $0.0500 level against the US Dollar. The ADA/USD pair started a decent recovery above the $0.0580 and $0.0600 resistance levels. Moreover, the pair surpassed the $0.0620 resistance and the 55 simple moving average (4-hours). Finally, the price tested the $0.0650 resistance, where it faced a strong selling interest.
A swing high was formed near $0.0651 and recently the price started a fresh decline. The price traded below a connecting bullish trend line with support near the $0.0615 level on the 4-hours chart. It broke the $0.0600 support level and the 55 simple moving average (4-hours). It opened the doors for more losses below the 50% Fibonacci retracement level of the last wave from the $0.0500 low to $0.0651 high.
Moreover, there was a break below the $0.0550 support level. At the moment, the price is trading just above the 76.4% Fibonacci retracement level of the last wave from the $0.0500 low to $0.0651 high. If there is a downside break below $0.0535, there could be more losses. The next key support is near the $0.0520 level, below which the price could retest the $0.0500 support.
On the upside, there are many hurdles near the $0.0600 level. An immediate resistance is near $0.0580 and the 55 simple moving average (4-hours). Moreover, there is a key bearish trend line forming with resistance near $0.0602 on the same chart. Therefore, the price is likely to face a lot of hurdles near the $0.0580 and $0.0600 levels.

The chart indicates that ADA price is trading in a bearish zone below the $0.0600 pivot level. As long as the price is below $0.0600, there are chances of more downsides. Above $0.0600, the price could recover towards the $0.0650 and $0.0670 levels in the near term.
Technical Indicators
4 hours MACD – The MACD for ADA/USD is currently losing pace in the bearish zone.
4 hours RSI – The RSI for ADA/USD is currently correcting higher above the 40 level, with a positive angle.
Key Support Levels – $0.0535 and $0.0500.
Key Resistance Levels – $0.0580 and $0.0600.


Leave a Reply
You must be logged in to post a comment.