- ADA price remained in a strong downtrend and broke the $0.0600 support area against the US Dollar.
- The price declined heavily and broke the $0.0550 and $0.0520 support levels.
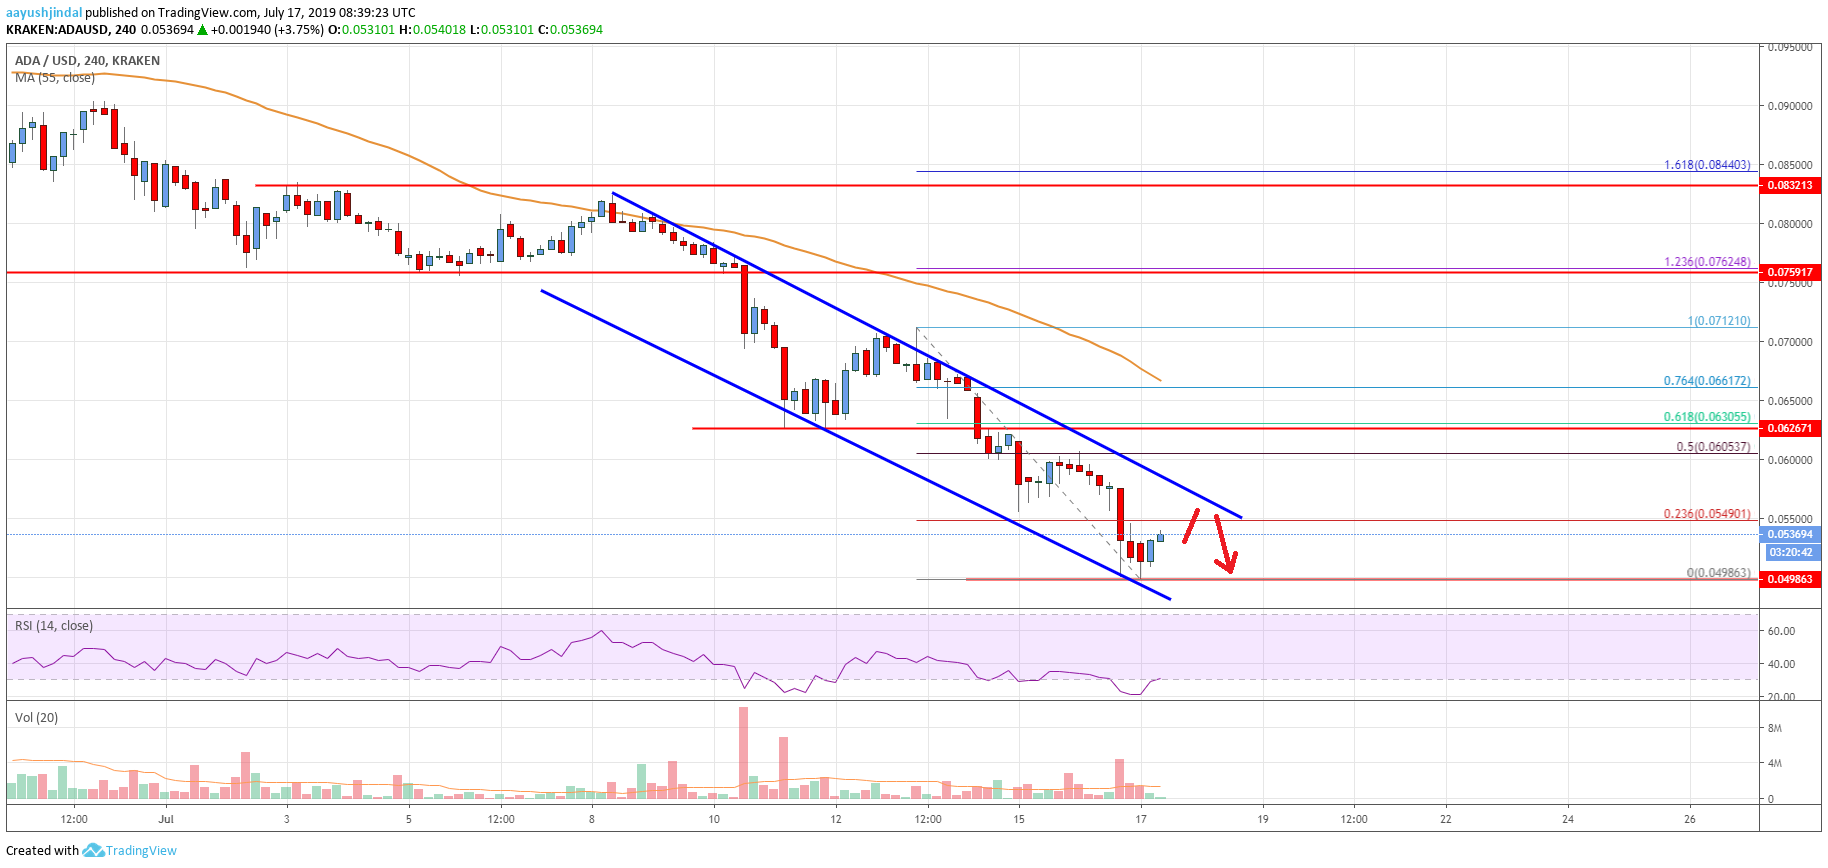
- There is a major declining channel forming with resistance near $0.0568 on the 4-hours chart (data feed via Kraken).
- The price remains in a downtrend and it could continue to move down below $0.0520.
Cardano price is trading with a bearish bias against the US Dollar and bitcoin. ADA recently tested the $0.0500 support area and it remains at a risk of more losses.
Cardano Price Analysis
After cardano price failed to climb above $0.0850, it declined heavily against the US Dollar. The ADA/USD pair broke the $0.0700 and $0.0650 support levels to register nasty losses. Moreover, there was a break below the $0.0630 support level and the 55 simple moving average (4-hours). Finally, the price broke $0.0600 and tested the $0.0500 level. A new monthly low was formed at $0.0498 and the price is currently correcting higher.
An initial resistance is near the $0.0549 level plus the 23.6% Fibonacci retracement level of the last decline from the $0.0712 high to $0.0498 low. Moreover, there is a major declining channel forming with resistance near $0.0568 on the 4-hours chart. Above the channel resistance, the next key resistance is near the $0.0600 level. The 50% Fibonacci retracement level of the last decline from the $0.0712 high to $0.0498 low is also near the $0.0605 level.
The main resistance is near the $0.0630 level, which was a major support earlier. A successful close above the $0.0600 and $0.0630 levels is needed for a fresh increase in cardano in the near term. The next key resistance above $0.0630 is near the $0.0762 level. If the price fails to climb above $0.0568 or $0.0600, it could start a fresh decline.
An immediate support is near the $0.0510 level, below which the price may break the $0.0498 swing low. The next stop for the bears may be near the $0.0480 level in the near term.

The chart indicates that ADA price is currently trading in a significant downtrend below the $0.0600 resistance level. In the short term, there could be an upside correction, but the price is likely to struggle near $0.0600 or $0.0630. If the bulls fail to gain momentum, the price is likely to slide towards or below $0.0500 in the coming days.
Technical Indicators
4 hours MACD – The MACD for ADA/USD is currently losing momentum in the bearish zone.
4 hours RSI – The RSI for ADA/USD is currently correcting higher towards the 40 level, with a positive angle.
Key Support Levels – $0.0510 and $0.0500.
Key Resistance Levels – $0.0568 and $0.0600.


Leave a Reply
You must be logged in to post a comment.