
- ADA price started a major declined from the $0.0620 resistance against the US Dollar.
- The price is now trading well below the $0.0600 and $0.0580 support levels.
- There was a break below a crucial contracting triangle with support near $0.0581 on the 4-hours chart (data feed via Kraken).
- The price remains at a risk of more losses below the $0.0520 and $0.0510 support levels.
Cardano price is trading in a downtrend against the US Dollar and bitcoin. ADA price is facing a strong selling pressure and it may soon revisit the $0.0500 support.
Cardano Price Analysis
After struggling near $0.0650, cardano price started a slow and steady decline against the US Dollar. The ADA/USD pair broke many important supports near $0.0620 and $0.0600 to enter a bearish zone. Moreover, there was a close below the $0.0600 support and the 55 simple moving average (4-hours). Finally, there was a break below a crucial contracting triangle with support near $0.0581 on the 4-hours chart.
It opened the doors for more downside below the $0.0580 support. The price even traded below the $0.0550 support and a new weekly low was formed near $0.0526 recently. Currently, the price is consolidating losses above $0.0525. An immediate resistance is near the $0.0550 level. Moreover, the 23.6% Fibonacci retracement level of the recent decline from the $0.0623 high to $0.0526 low is also near the $0.0550 level.
Additionally, there is a connecting bearish trend line forming with resistance near $0.0565 on the same chart. If there is a successful break above the $0.0565 resistance, there could be a decent recovery. The next key resistance is near the $0.0580 level, the 55 simple moving average (4-hours), and the 50% Fibonacci retracement level of the recent decline from the $0.0623 high to $0.0526 low.
Conversely, if the price fails to recover, it could decline below the $0.0525 and $0.0520 support levels. In the mentioned bearish case, the price is likely to surpass the $0.0510 support as well. The main support is near the $0.0500 level, where the bulls may take a stand.
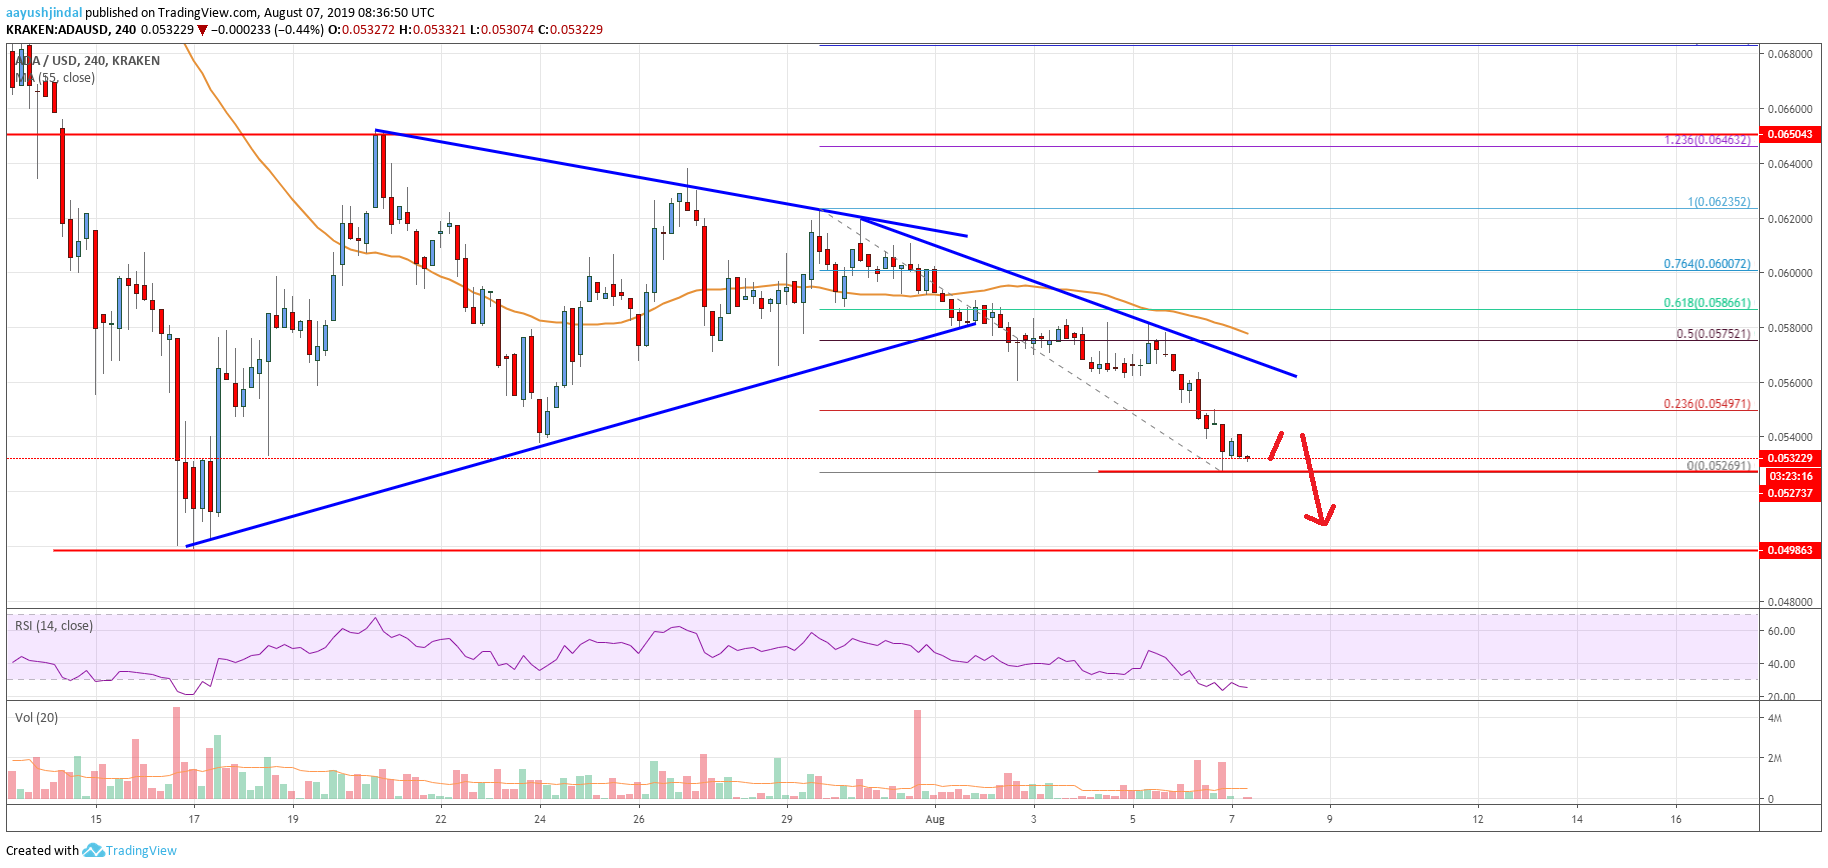
The chart indicates that ADA price is clearly trading in a strong downtrend below $0.0550 and $0.0580. As long as the price is below $0.0580, there is a risk of more losses in the near term. On the downside, the most important support is at $0.0500, below which the price could decline significantly.
Technical Indicators
4 hours MACD – The MACD for ADA/USD is currently gaining momentum in the bearish zone.
4 hours RSI – The RSI for ADA/USD is currently well below the 30 level, with no major sign of a recovery.
Key Support Levels – $0.0520 and $0.0500.
Key Resistance Levels – $0.0550 and $0.0580.


Leave a Reply
You must be logged in to post a comment.