- Bitcoin price is gaining momentum above the $6,800 and $7,000 resistance levels against the US Dollar.
- A high was formed near $7,471 and it seems like the bulls are eyeing more gains towards $8,000.
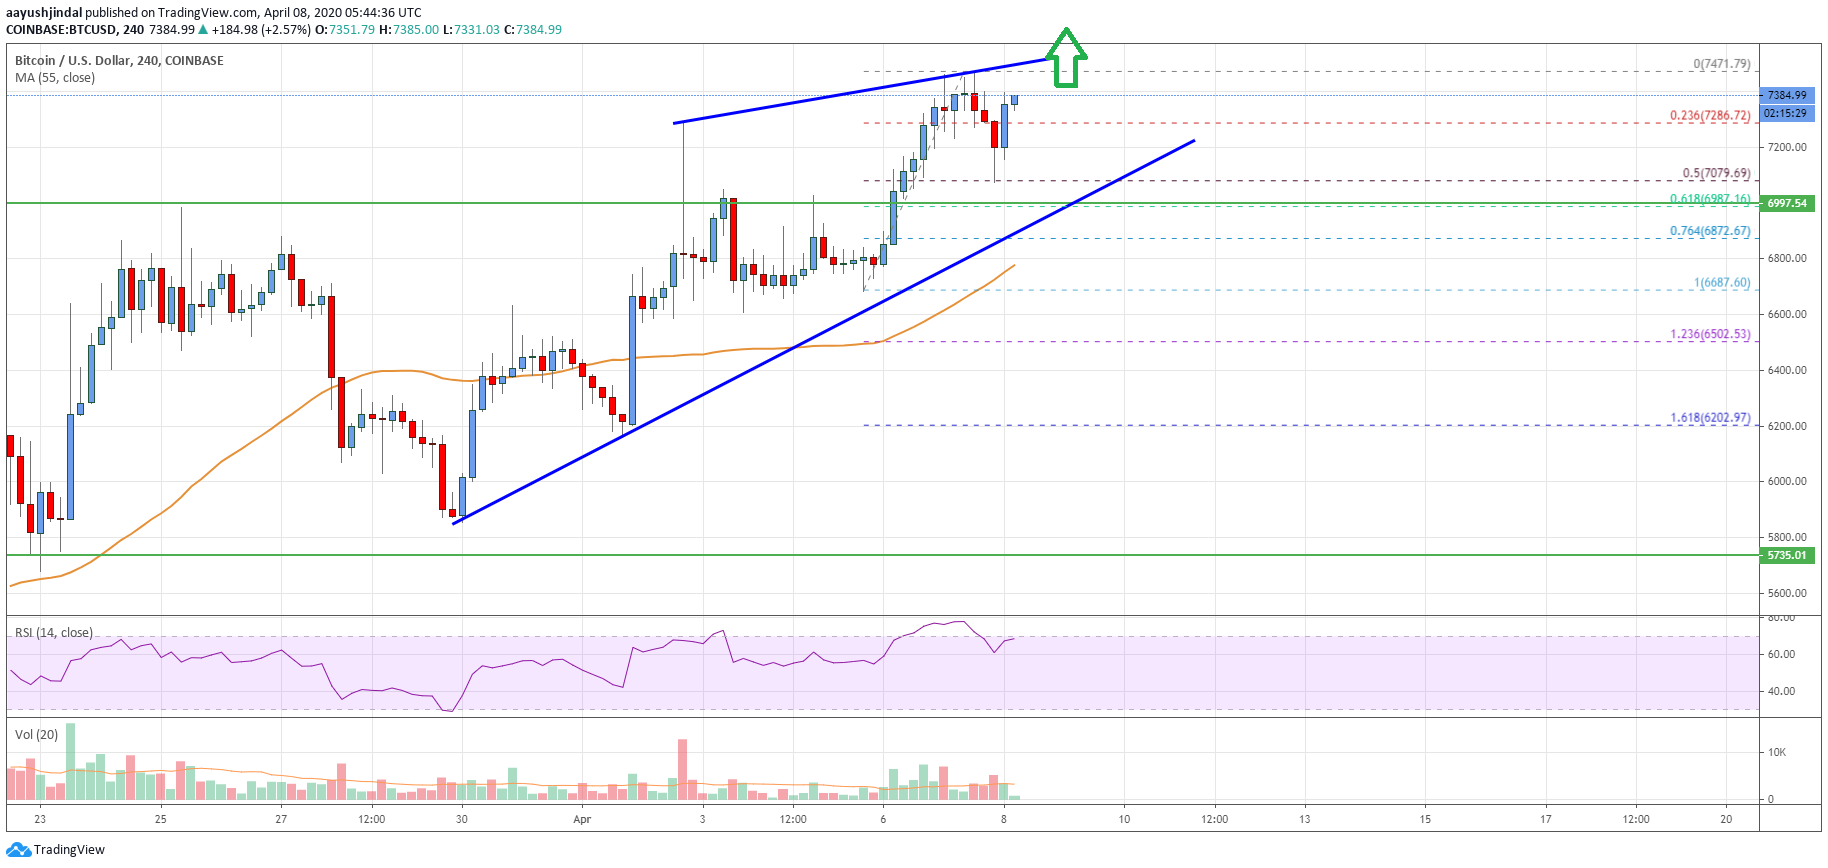
- There is a major bullish trend line forming with support near $7,090 on the 4-hours chart of the BTC/USD pair (data feed from Coinbase).
- The pair remains in a strong uptrend and dips remain supported near $7,090 and $6,800.
Bitcoin price is trading in a bullish zone above $7,000 against the US Dollar. BTC could continue to rise if it breaks the $7,500 resistance area in the near term.
Bitcoin Price Analysis
In the past few days, there was a strong upward move in bitcoin price above the $6,500 resistance against the US Dollar. BTC even settled nicely above the $7,000 barrier and the 55 simple moving average (4-hours).
The upward move was such that the price traded to a new monthly high at $7,471. Recently, there was a downside correction below the $7,300 level. The price traded below the 23.6% Fib retracement level of the upward move from the $6,687 low to $7,471 high.
However, the decline was well protected by the $7,080-$7,090 zone. Besides, the 50% Fib retracement level of the upward move from the $6,687 low to $7,471 high acted as a strong support.
There is also a major bullish trend line forming with support near $7,090 on the 4-hours chart of the BTC/USD pair. The pair is currently rising and trading above the $7,300 level. An initial resistance is near the $7,471 high.
A successful break above the $7,471 high might open the doors for a larger upward move above $7,500. In the mentioned case, the price may perhaps rally towards the $7,880 and $8,000 resistance levels in the near term.
On the downside, the main support is forming near the $7,080-$7,090 zone. If the price fails to stay above the trend line and $7,080, it could start a major downside correction. The next key support is seen near the $6,800 level and the 55 simple moving average (4-hours).
Looking at the chart, bitcoin price is trading in a bullish trend above the $7,000 support. If the bulls remain in action in the coming days, the price is likely to rally above towards the $8,000 level.
Technical indicators
4 hours MACD – The MACD is now gaining pace in the bullish zone.
4 hours RSI (Relative Strength Index) – The RSI is currently well above the 60 level.
Key Support Levels – $7,080 and $6,800.
Key Resistance Levels – $7,500, $7,880 and $8,000.
