
- Bitcoin price started a major downside correction after it traded as high as $10,954 against the US Dollar.
- The price is currently trading near a major support area at $10,000, which holds the key.
- There is a major bullish trend line forming with support near $10,000 on the 4-hours chart of the BTC/USD pair (data feed from Coinbase).
- The pair remains well supported on dips near the $10,000 and $9,800, below which it could gain bearish momentum.
Bitcoin price is struggling to bounce back above $10,500 against the US Dollar. BTC must stay above $10,000 and $9,800 to bounce back in the coming sessions.
Bitcoin Price Analysis
This past week, bitcoin price climbed higher above the $10,800 level against the US Dollar. The BTC/USD pair even traded close to the $11,000 level. However, it failed to continue higher and topped near the $10,954 level. Recently, there was a fresh decline below the key $10,500 support area. It opened the doors for more downsides below the $10,400 level. Moreover, there was a close below $10,400 and the 55 simple moving average (4-hours).
During the decline, the price broke the 50% Fib retracement level of the last major upward move from the $9,331 low to $10,954 high. The decline was such that the price even broke the $10,000 support area. However, the $9,950 level is acting as a support. Moreover, the 61.8% Fib retracement level of the last major upward move from the $9,331 low to $10,954 high is also acting as a support.
On the downside, there is a major bullish trend line forming with support near $10,000 on the 4-hours chart of the BTC/USD pair. If there is a downside break below $10,000 and the trend line, there could be more losses. An immediate support is near the $9,800 level plus the 76.4% Fib retracement level of the last major upward move from the $9,331 low to $10,954 high.
If there is a close below the $9,800 support, bitcoin price could accelerate its decline. In the mentioned bearish case, the price could continue to slide towards the $9,500 level. The next major support is near the $9,400 level and the last swing low. On the upside, an immediate resistance is near the $10,300 level. However, the main support is near the $10,400 level and the 55 SMA.
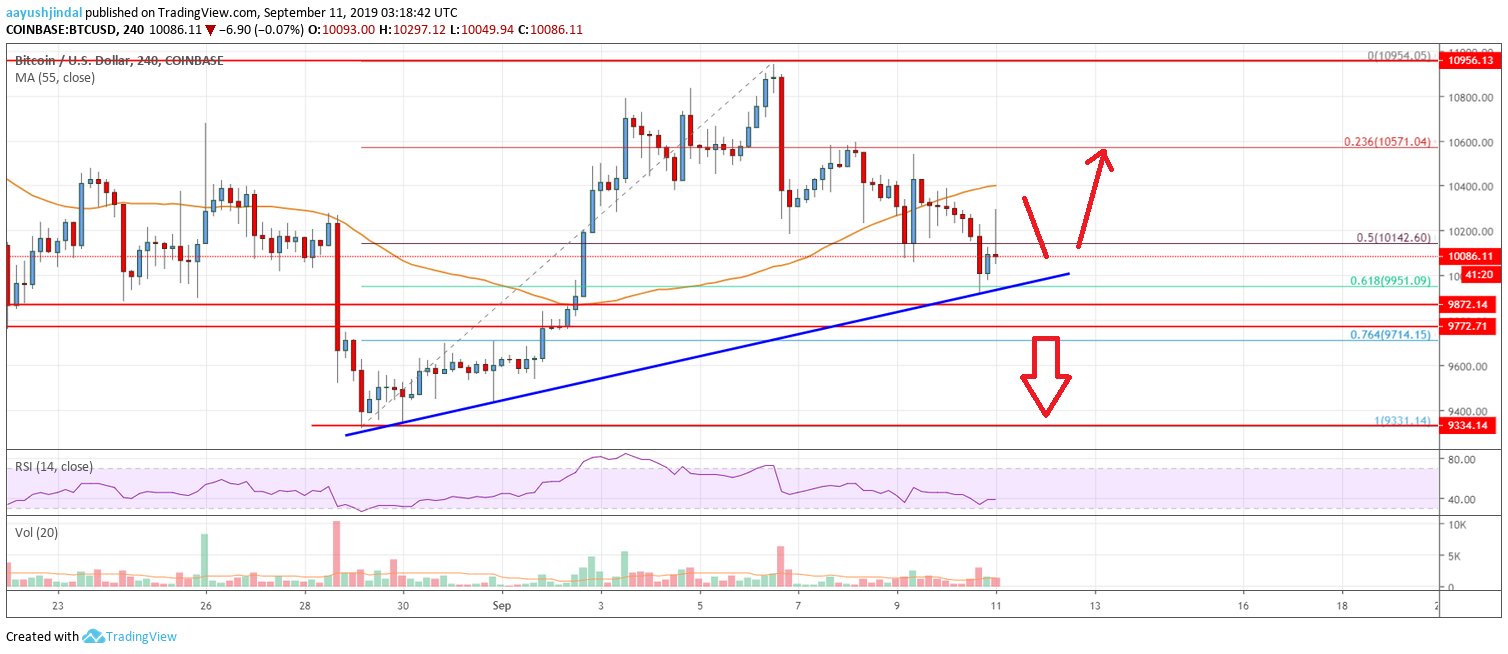
Looking at the chart, bitcoin price is clearly trading near a crucial support area at $10,000. If there is a downside break below $9,800, the price could decline heavily. If not, it could bounce back above $10,400.
Technical indicators
4 hour MACD – The MACD is currently gaining pace in the bearish zone.
4 hour RSI (Relative Strength Index) – The RSI is currently well below the 45 level.
Key Support Levels – $10,000 and $9,800.
Key Resistance Levels – $10,300, $10,400 and $10,500.


Leave a Reply
You must be logged in to post a comment.