
- Bitcoin price started a nice upward move after forming a base near $9,340 against the US Dollar.
- The price is trading with a positive bias and it broke the $10,000 and $10,400 resistance levels.
- There was a break above a crucial bearish trend line with resistance near $9,980 on the 4-hours chart of the BTC/USD pair (data feed from Coinbase).
- The pair might correct lower in the short term, but it is likely to climb higher above $10,750 and $10,850.
Bitcoin price is back in a bullish zone above $10,250 against the US Dollar. BTC is showing positive signs and it could rise further towards the $10,950 and $11,200 resistances.
Bitcoin Price Analysis
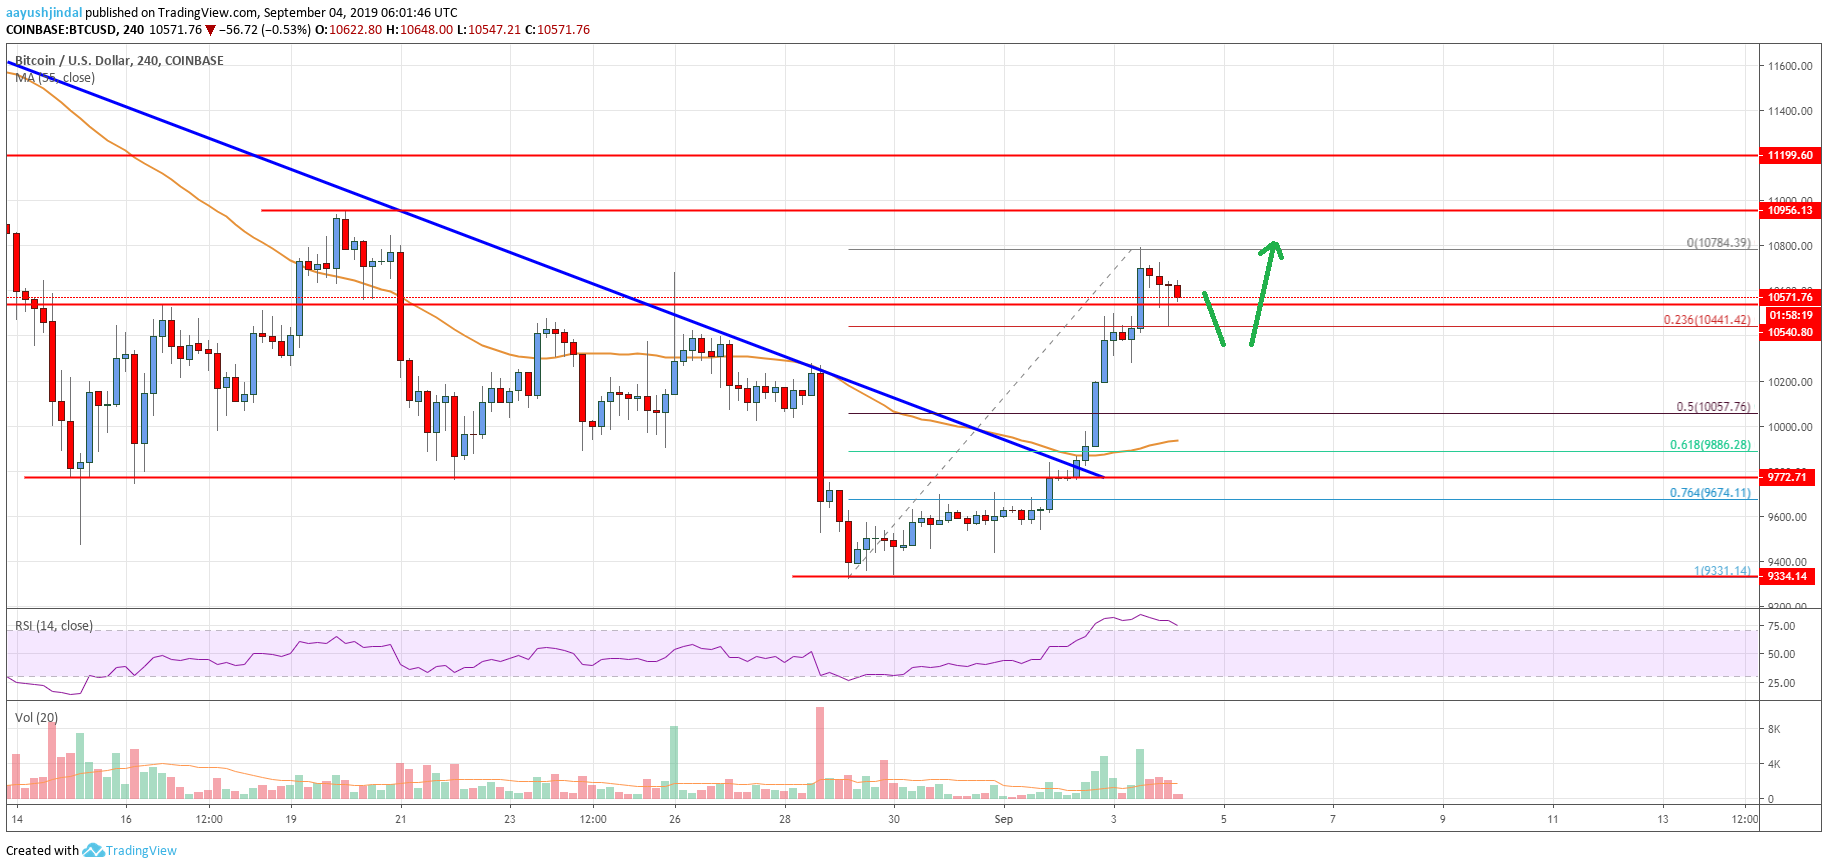
This past week, bitcoin price extended its decline below the key $9,780 support against the US Dollar. The BTC/USD pair even broke the $9,500 support and settled below the 55 simple moving average (4-hours). Finally, the price traded as low as $9,331 and later formed a solid support base near the $9,340 level. As a result, the price started a strong upward move above the $9,500 and $9,780 resistance levels.
Moreover, there was a break above a crucial bearish trend line with resistance near $9,980 on the 4-hours chart of the BTC/USD pair. It opened the doors for more gains above the $10,000 resistance and the 55 simple moving average (4-hours). The pair even surged above the $10,500 resistance level. It traded as high as $10,784 recently and it is currently correcting gains.
An immediate support is near $10,440 plus the 23.6% Fib retracement level of the recent rally from the $9,331 low to $10,784 high. If there is an extended downside correction, the price could trade towards the $10,220 and $10,200 support levels. The next key support is near the $10,000 level since it coincides with the 50% Fib retracement level of the recent rally from the $9,331 low to $10,784 high.
On the upside, an immediate resistance is near the $$10,780 and $10,800 levels. A successful break above the $10,800 level could accelerate gains above the $10,900 level. The next target for the bulls may perhaps be near the $11,200 level, where the bearish might appear.
Looking at the chart, bitcoin price is clearly trading with a positive trend above the $10,440 and $10,220 support levels. In the short term, there could be a downside correction below $10,440, but the price is likely to find buyers near $10,220 or $10,000.
Technical indicators
4 hour MACD – The MACD is currently reducing its bullish slope.
4 hour RSI (Relative Strength Index) – The RSI is currently correcting lower from well above the 75 level.
Key Support Levels – $10,440 and $10,220.
Key Resistance Levels – $10,780, $10,950 and $11,200.


Leave a Reply
You must be logged in to post a comment.