- Bitcoin price started a strong upward move after trading as low as $9,481 against the US Dollar.
- The price is currently trading above the $10,500 level and it recently tested the $11,000 resistance.
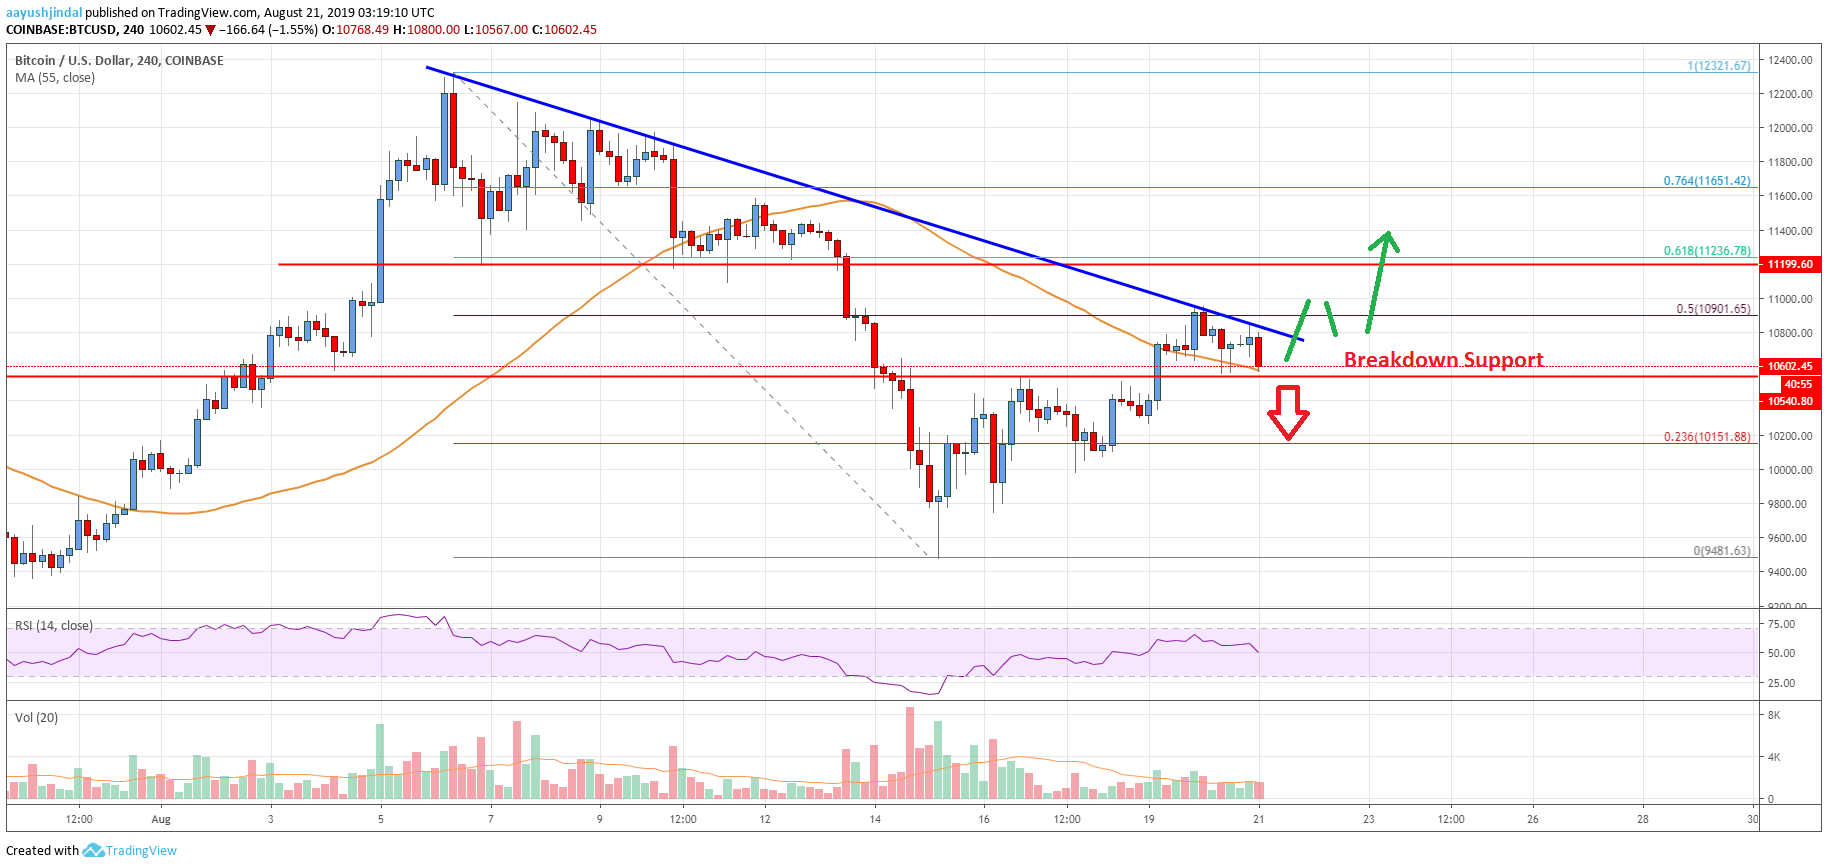
- There is a crucial bearish trend line forming with resistance near $11,000 on the 4-hours chart of the BTC/USD pair (data feed from Coinbase).
- The pair is struggling to gain strength and it might decline sharply below the $10,500 support.
Bitcoin price is struggling to surpass important resistances near $11,000 against the US Dollar. BTC could either rally above $11,000 or it might slide below $10,500.
Bitcoin Price Analysis
This past week, bitcoin price extended its decline below the $10,500 and $10,200 supports against the US Dollar. The BTC/USD pair even broke the $9,800 support and settled below the 55 simple moving average (4-hours). Finally, the pair tested the $9,500 support and a new monthly low was formed at $9,481. Recently, the pair started an upside correction and traded above the $10,000 resistance level.
Moreover, there was a break above the 23.6% Fib retracement level of the last major decline from the $12,321 high to $9,481 low. The bulls even managed to push the price above the $10,500 level and the 55 simple moving average (4-hours). However, the upward move was capped by the key $10,950 and $11,000 resistance levels. More importantly, there is a crucial bearish trend line forming with resistance near $11,000 on the 4-hours chart of the BTC/USD pair.
Additionally, the 50% Fib retracement level of the last major decline from the $12,321 high to $9,481 low is capping upsides near the $10,920 level. At the moment, the price is correcting lower below $10,700. An immediate support is near the $10,500 level and the 55 simple moving average (4-hours). It seems like the $10,500 support might play an important role.
The price could both bounce back from $10,500 and break the $11,000 resistance or it might start a fresh decline. A successful close below the $10,500 support might put the bulls on the back foot. The next key support on the downside below $10,500 is near the $10,000 level.
Looking at the chart, bitcoin price is clearly approaching the next key break either above $11,000 or below $10,500. As long as there is no daily close below $10,500, there are chances of a strong upward move towards $12,000. If not, the price might slide back towards the $9,500 level.
Technical indicators
4 hour MACD – The MACD is currently losing momentum in the bullish zone.
4 hour RSI (Relative Strength Index) – The RSI is currently declining towards the 50 level.
Key Support Levels – $10,500 and $10,200.
Key Resistance Levels – $10,900, $11,000 and $11,200.


Leave a Reply
You must be logged in to post a comment.