- Bitcoin price is trading well below the $10,550 and $10,450 resistance levels against the US Dollar.
- The price is trading above the monthly support near $9,750, but remains at a risk of a downside break.
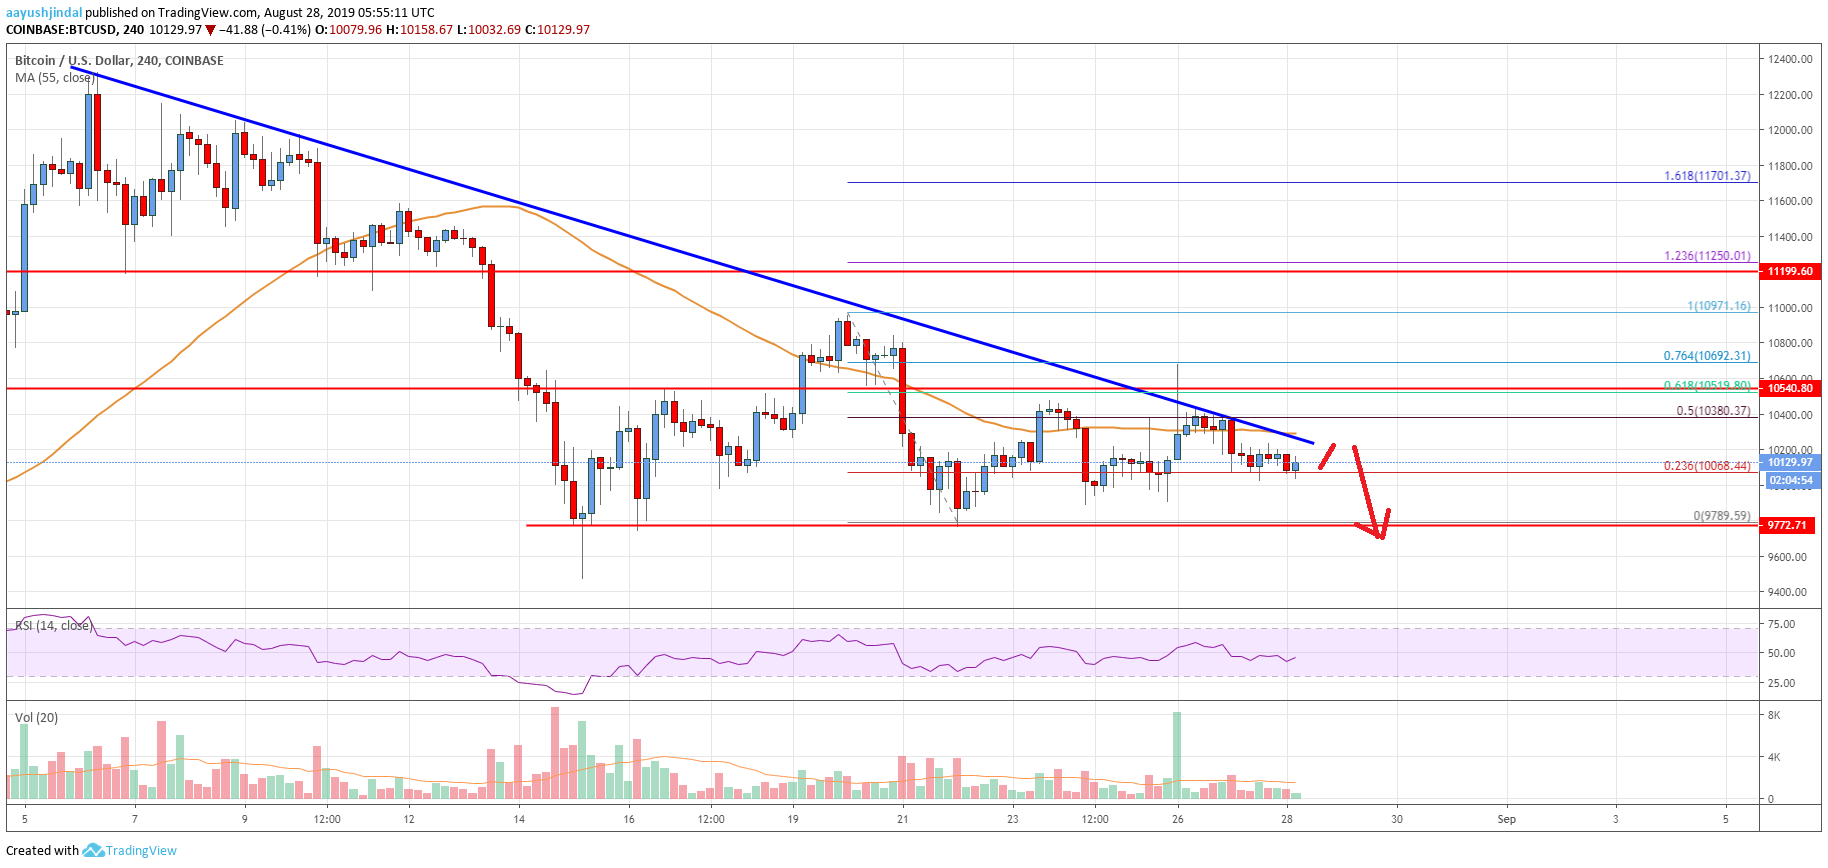
- There is a significant bearish trend line forming with resistance near $10,280 on the 4-hours chart of the BTC/USD pair (data feed from Coinbase).
- The pair might decline heavily if it fails to correct above $10,300 and $10,550 in the coming sessions.
Bitcoin price is facing a lot of hurdles below $10,550 against the US Dollar. BTC could either recover above $10,300 or extend its decline below the $9,750 support.
Bitcoin Price Analysis
In the past few days, bitcoin price struggled to gain momentum above the $10,500 and $10,550 resistances against the US Dollar. The BTC/USD pair slowly declined and traded below the $10,200 support plus the 55 simple moving average (4-hours). The price even broke the $10,000 support and revisited the main $9,750 and $9,775 support levels, where the bulls protected additional losses.
The last swing low was formed near $9,789 before the price corrected above $10,000s. It traded above the $10,200 resistance level. Moreover, the price moved above the 23.6% Fib retracement level of the key drop from the $10,971 high to $9,789 low. However, the price failed to gain strength above the $10,400 level and the 55 simple moving average (4-hours).
Additionally, the 50% Fib retracement level of the key drop from the $10,971 high to $9,789 low acted as a resistance. As a result, there was a fresh decline below $10,200. The price is now trading well below $10,400 and the 55 SMA. More importantly, there is a significant bearish trend line forming with resistance near $10,280 on the 4-hours chart of the BTC/USD pair.
Therefore, the price must break the trend line, $10,300, and the 55 simple moving average (4-hours) to move into a positive zone. The next important resistances are near the $10,550 level. If there are more upsides, the price could continue to rise towards the $11,000 resistance level. Conversely, if there is no upside break above $10,300, the price is likely to extend its decline.

Looking at the chart, bitcoin price is clearly following a bearish path below the $10,300, $10,400 and $10,550 resistance levels. Therefore, a downside break below $10,000 and $9,750 is likely to accelerate losses. The next key supports are $9,500, $9,420 and $9,250.
Technical indicators
4 hour MACD – The MACD is showing signs of weakness in the bearish zone.
4 hour RSI (Relative Strength Index) – The RSI is slowly recovering higher towards the 50 level.
Key Support Levels – $10,000 and $9,750.
Key Resistance Levels – $10,300, $11,400 and $11,500.


Leave a Reply
You must be logged in to post a comment.