
- ADA price declined heavily and traded close to the $0.0430 level against the US Dollar.
- The price is currently correcting higher, but upsides are likely to remain capped near $0.0480.
- There was a break above a bearish trend line with resistance near $0.0445 on the 4-hours chart (data feed via Kraken).
- The price is likely to decline once again unless the bulls push the price above $0.0480.
Cardano price is trading in a bearish zone against the US Dollar and bitcoin. ADA price is facing a lot of hurdles on the upside near the $0.0480 and $0.0500 levels.
Cardano Price Analysis
This past week, there was a sharp decline in cardano price below the $0.0500 and $0.0480 support levels against the US Dollar. The ADA/USD pair even broke the $0.0450 support and settled below the 55 simple moving average (4-hours). Finally, it traded as low as $0.0433 and recently started an upside correction. There was a break above the $0.0440 and $0.0450 resistance levels.
Additionally, the price traded above the 23.6% Fibonacci retracement level of the last decline from the $0.0526 high to $0.0433 low. More importantly, there was a break above a bearish trend line with resistance near $0.0445 on the 4-hours chart. The pair even climbed above $0.0470 and 55 simple moving average (4-hours). However, it failed to continue higher and even was not able to test the main $0.0480 resistance area.
Moreover, the 50% Fibonacci retracement level of the last decline from the $0.0526 high to $0.0433 low is near the $0.0480 level. At the moment, cardano price is declining and is trading below the $0.0460 level. An immediate support is near the $0.0455 level. If the price fails to recover, it could decline back towards the $0.0435 support area in the near term.
On the upside, there is a strong resistance forming near the $0.0480 level. The next key resistance is near $0.0500 or the 76.4% Fibonacci retracement level of the last decline from the $0.0526 high to $0.0433 low. The last line of defense for the bears for a trend change is near the $0.0526 level.
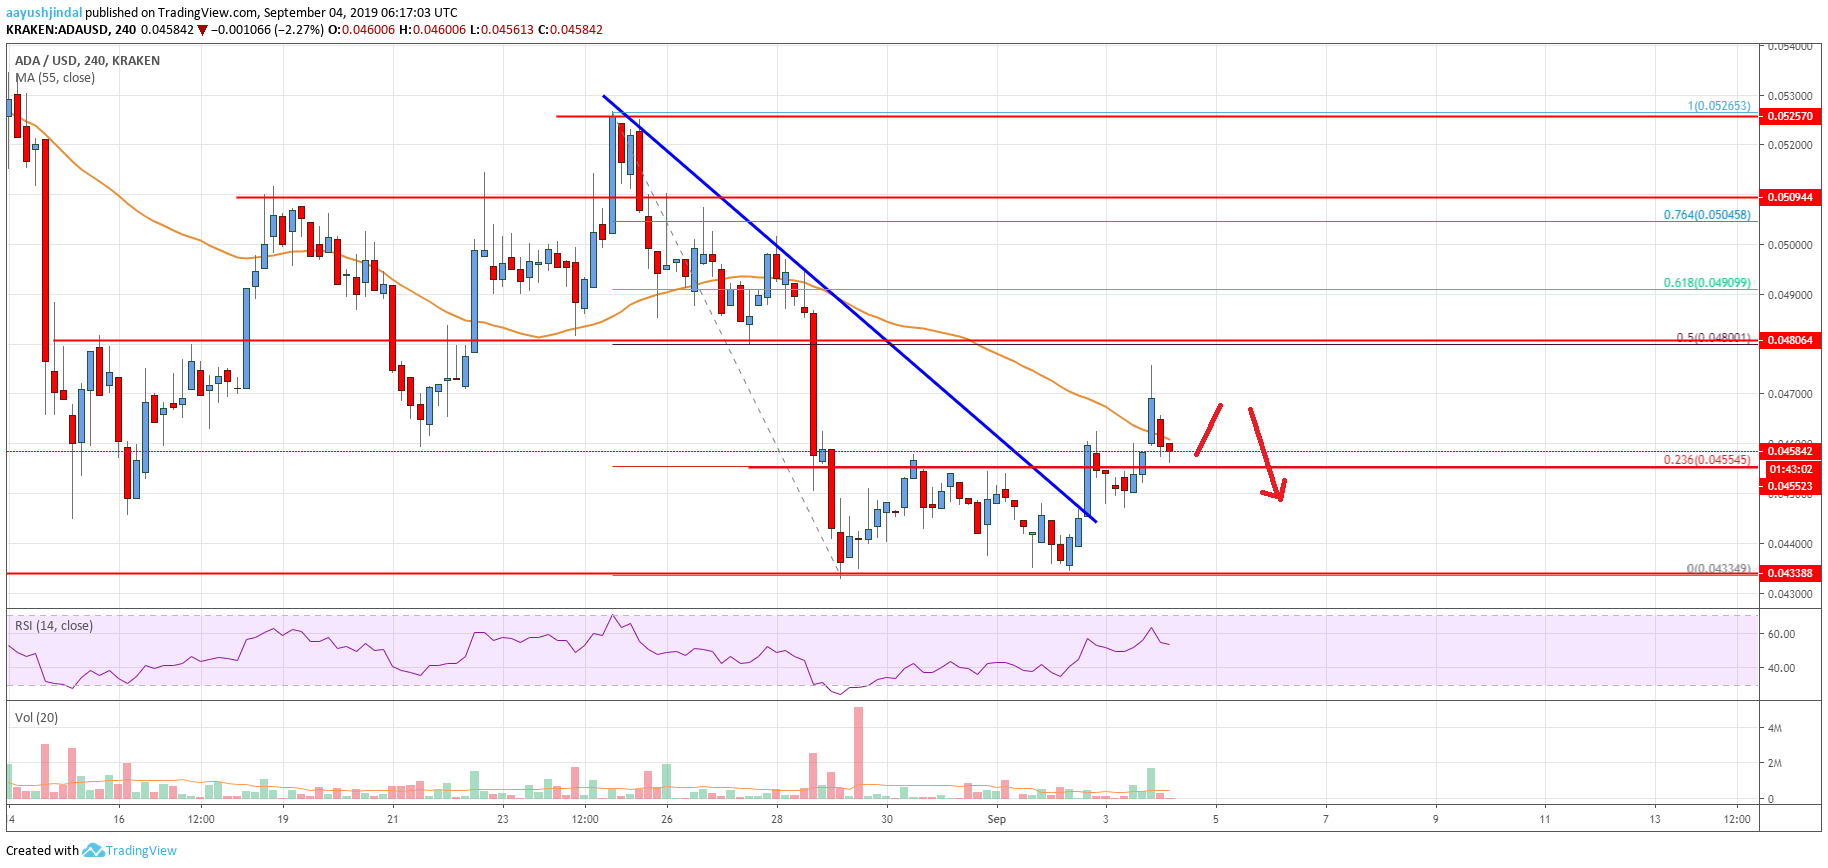
The chart indicates that ADA price is clearly facing a strong selling interest below the $0.0480 resistance level. Therefore, there is a risk of another decline below $0.0455 as long as the price is below $0.0480 and $0.0500. ON the downside, the main supports are near $0.0435 and $0.0405.
Technical Indicators
4 hours MACD – The MACD for ADA/USD is about to move back into the bearish zone.
4 hours RSI – The RSI for ADA/USD is currently moving lower and likely to test the 50 level.
Key Support Levels – $0.0435 and $0.0405.
Key Resistance Levels – $0.0480 and $0.0500.


Leave a Reply
You must be logged in to post a comment.