- ADA price is trading below the key $0.0525 and $0.0550 resistances against the US Dollar.
- The price is likely preparing for the next move and it could slide towards $0.0450.
- There is a breakout pattern forming with resistance near $0.0515 on the 4-hours chart (data feed via Kraken).
- The price could either break above the $0.0525 resistance or it might slide further towards $0.0450.
Cardano price is showing a few signs of a recovery against the US Dollar and bitcoin. Still, ADA price might decline sharply before it could bounce back above $0.0520 and $0.0550.
Cardano Price Analysis
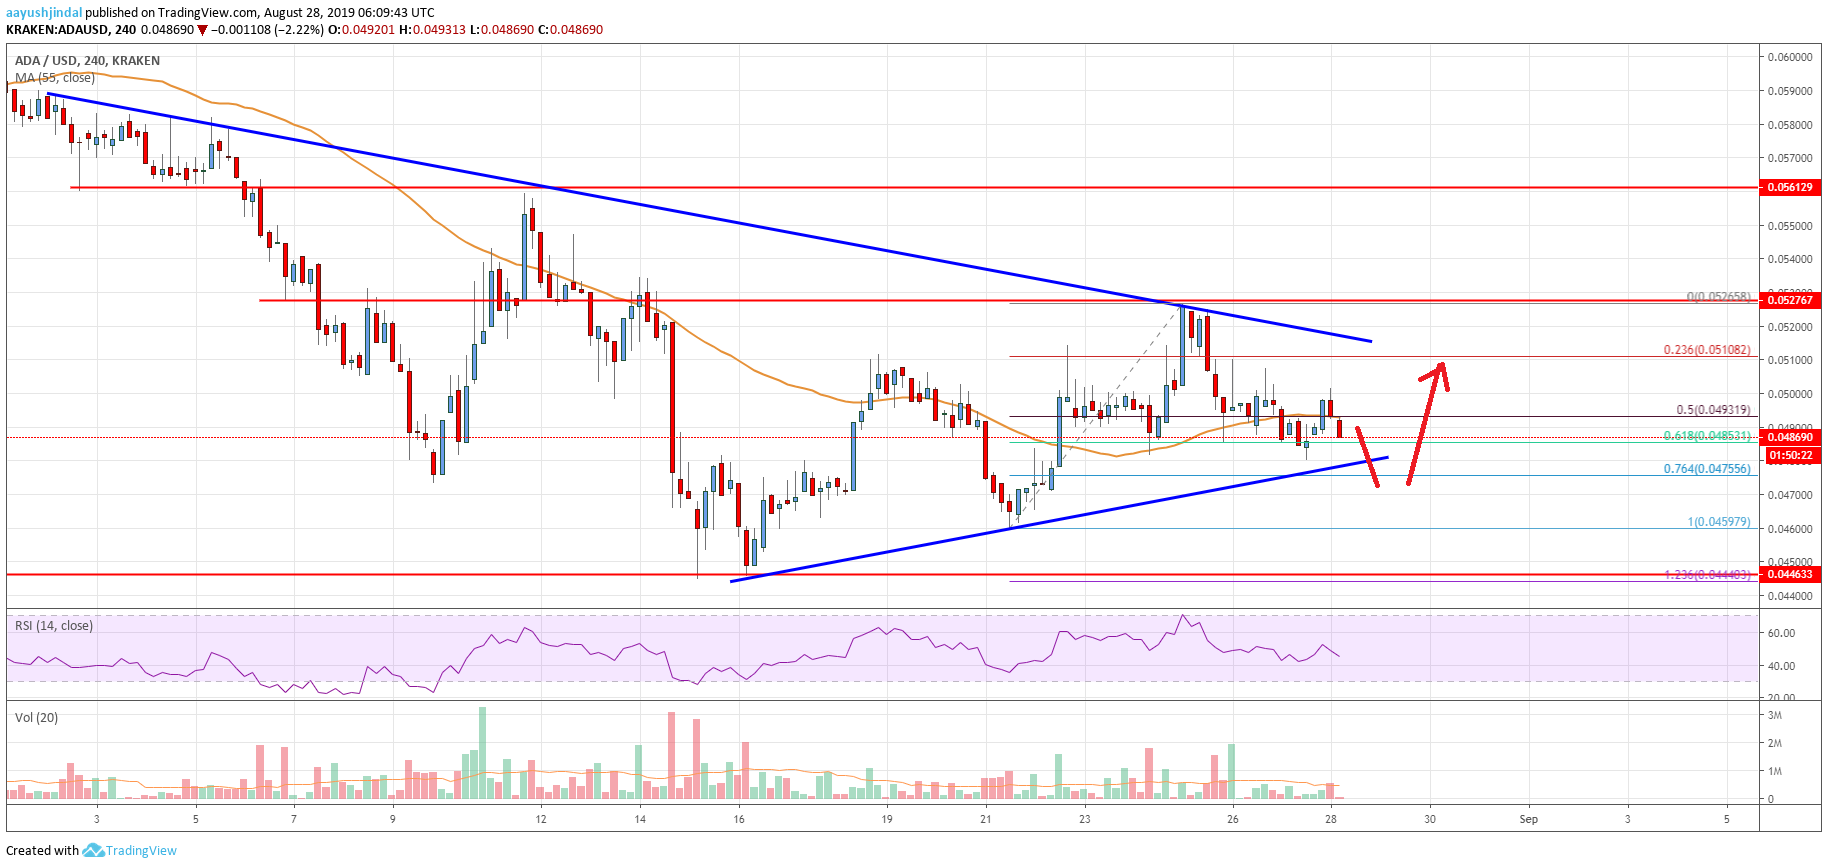
Recently, cardano price recovered nicely from the $0.0459 swing low against the US Dollar. The ADA/USD pair climbed above the $0.0500 resistance level. Moreover, there was a close above the $0.0500 level and the 55 simple moving average (4-hours). However, the price struggled to surpass a major resistance area near the $0.0525 level. A swing high was formed near $0.0526 and the price declined below $0.0510.
The price declined below the 50% Fibonacci retracement level of the last wave from the $0.0459 low to $0.0526 high. Additionally, there was a break below the $0.0500 support and the 55 simple moving average (4-hours). On the downside, there are a few key supports near the $0.0480 and $0.0475 levels. The 76.4% Fibonacci retracement level of the last wave from the $0.0459 low to $0.0526 high might also provide support.
More importantly, there is a breakout pattern forming with resistance near $0.0515 on the 4-hours chart. An immediate resistance on the upside is near the $0.0500 level. The next resistance is near the triangle trend line at $0.0515. If there is a break above $0.0515, the price could test the main $0.0525 resistance level. To move into an uptrend and climb substantially, the price must break the $0.0525 resistance.
Conversely, if the price fails to surpass $0.0515 or $0.0525, it could decline below the $0.0475 support. The next key support is near the $0.0450 level, below which the price may perhaps drop towards the $0.0420 level.

The chart indicates that ADA price is clearly struggling and facing many hurdles near $0.0510 and $0.0525. The next move could be either above the $0.0525 resistance or towards the $0.0450 and $0.0420 supports. The price action is slightly positive, but there could be a sharp decline below $0.0475 before the price starts a solid upward move.
Technical Indicators
4 hours MACD – The MACD for ADA/USD is slowly reducing its bearish slope.
4 hours RSI – The RSI for ADA/USD is currently under pressure below the 50 level, with a bearish angle.
Key Support Levels – $0.0475 and $0.0450.
Key Resistance Levels – $0.0515 and $0.0525.


Leave a Reply
You must be logged in to post a comment.