
- ADA price extended losses and tested the $0.0475 level against the US Dollar.
- The price is currently correcting higher, but it is facing a strong resistance near $0.0540 and $0.0550.
- There is a crucial bearish trend line forming with resistance near $0.0542 on the 4-hours chart (data feed via Kraken).
- The price could either break above the $0.0540 resistance or it could again slide below $0.0500.
Cardano price is facing an uphill task against the US Dollar and bitcoin. ADA price might resume its decline if it fails to climb above $0.0540 and $0.0560.
Cardano Price Analysis
Recently, cardano price extended its losses below the key $0.0560 and $0.0550 supports against the US Dollar. The ADA/USD pair even broke the $0.0520 support and settled well below the 55 simple moving average (4-hours). Finally, the price broke the $0.0500 support and traded to a new monthly low at $0.0475. It is currently correcting higher and already recovered above the $0.0500 level.
Moreover, it climbed above $0.0520 level, but the $0.0560 level acted as a strong resistance. The price declined again and the last swing low was formed near $0.0498. It is currently trading near the $0.0520 level and the 55 simple moving average (4-hours). Additionally, the 50% Fibonacci retracement level of the recent decline from the $0.0561 high to $0.0498 low is also near the $0.0529 level.
The main resistance on the upside is near the $0.0540 level. More importantly, there is a crucial bearish trend line forming with resistance near $0.0542 on the 4-hours chart. The 61.8% Fibonacci retracement level of the recent decline from the $0.0561 high to $0.0498 low is also near the $0.0537 level to act as a resistance. If there is an upside break above the $0.0540 resistance, the price could test the $0.0560 resistance.
Conversely, if the price fails to surpass $0.0540 or $0.0560, there could be another bearish wave. An immediate support is near the $0.0500 level. If there is a downside break below $0.0500, the price is likely to revisit the $0.0475 level. Any further losses might call for a test of the $0.0450 support.
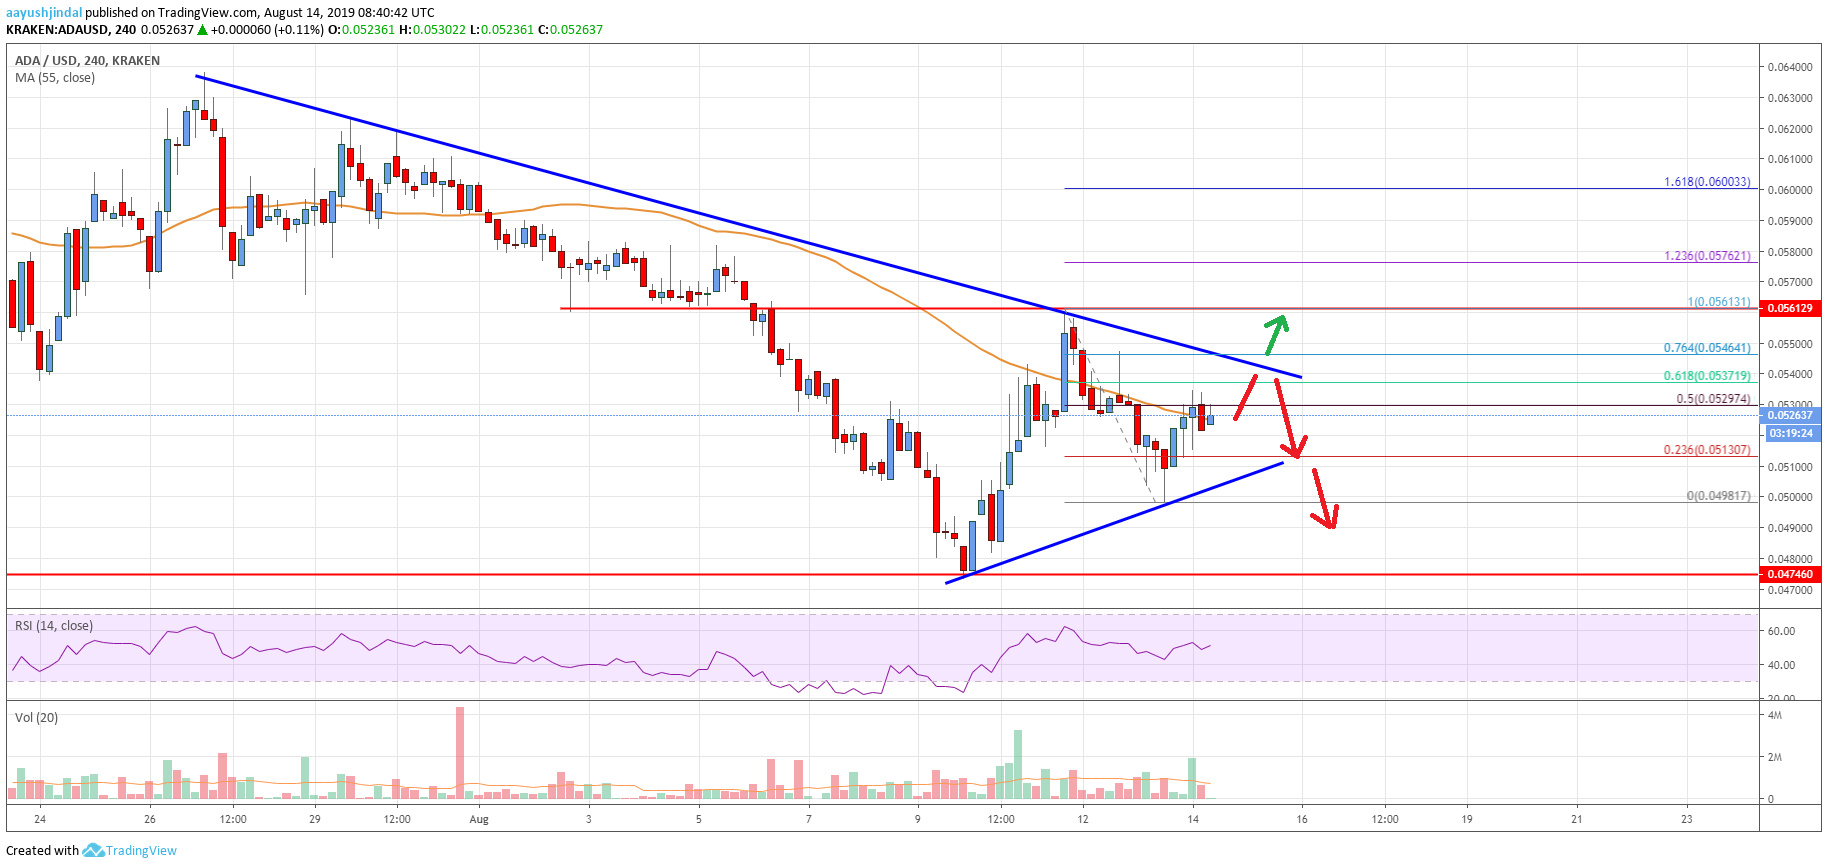
The chart indicates that ADA price is clearly preparing for the next crucial move either above $0.0540 or below the $0.0500 support. If there is a downside break below $0.0500, the price is likely to accelerate losses towards the $0.0475 and $0.0450 levels.
Technical Indicators
4 hours MACD – The MACD for ADA/USD is currently losing momentum in the bullish zone.
4 hours RSI – The RSI for ADA/USD is currently just above the 50 level, with a minor bullish angle.
Key Support Levels – $0.0500 and $0.0475.
Key Resistance Levels – $0.0540 and $0.0560.


Leave a Reply
You must be logged in to post a comment.