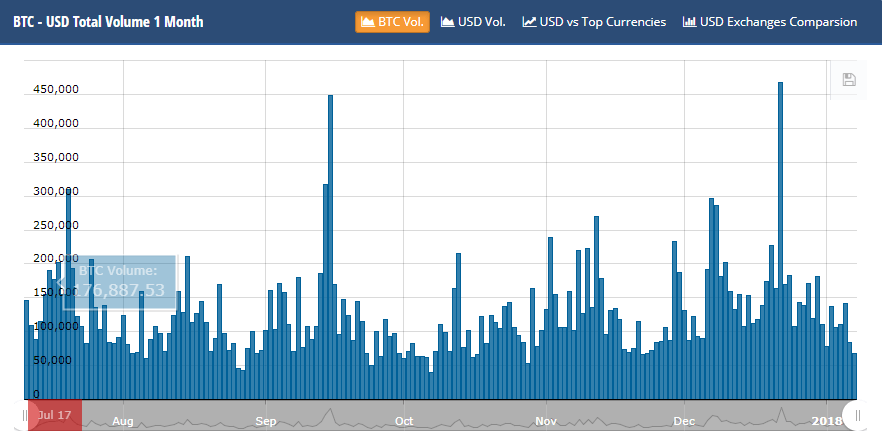
After recording a day high of around $17,244 on Bitfinex yesterday, bitcoin price declined to $16,033 during today’s trading sessions. Regardless of technical analysis of the charts, a considerable percentage of cryptomarket’s conventional investors have been choosing to refrain from using bitcoin during the past few weeks due to multiple reasons including the high transaction fees, extreme volatility levels and the delay in confirmation of transactions. This was reflected on the market’s trading volume which has been dropping since the beginning of the new year as shown by the below BTCUSD trading volume chart from CryptoCompare. So, will bitcoin price continue dropping?
An Elliott Wave Sequence Forming On the 1 Day BTCUSD Chart:
By examining the 1 day BTCUSD chart from Bitfinex, (Look at the below chart). We can observe the following:
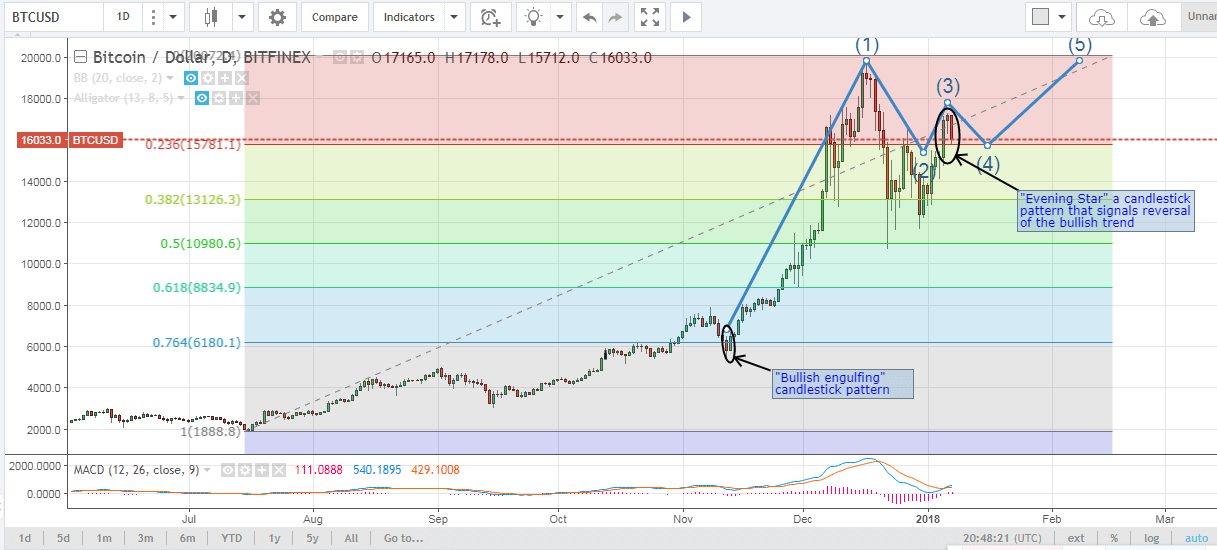
- We can set a Fibonacci retracement that extends between the low recorded on the 14th of July, 2017 ($1,888.8) and the high recorded on the 17th of December, 2017 ($20,072.4) to identify key resistance and support levels. As such, the 23.6% Fib retracement level, which corresponds to the $15,781.1 price level, represents a key support level that will resist further price drop, so we expect to see bitcoin price continue dropping until this level is reached.
- An “evening star” candlestick pattern can be spotted (look at the 3 candlesticks highlighted by an ellipse on the above chart). This candlestick pattern signals reversal of the bullish trend, so bitcoin price is likely to drop to test the support level around $15,781.1.
- A 5 wave Elliot pattern can be observed on the 1 day BTCUSD chart, as shown on the above chart, starting from the 12th of November, 2017, after a “bullish engulfing” candlestick pattern was formed back then. The 1st impulse wave took bitcoin price up to a historical high on the 17th of December, 2017 ($20,072.4). This was followed by the 2nd corrective wave which continued to pull bitcoin price downwards to $11,608 on the 30th of December. Afterwards, the 3rd impulse wave started pushing bitcoin price upwards reaching $17,317 yesterday. The 4th corrective wave started forming today, as the day’s trading sessions were represented by a bearish candlestick, as shown on the above chart. Most probably, the 4th corrective wave will continue on by another 2-4 bearish candlesticks (note: each candlestick represents 24 hours of trading) taking price downwards to test the support level around the 23.6% Fib retracement, or we can see it drop further downwards to the next support level around $13,126.3, which corresponds to the 38.2% Fib retracement.
Conclusion:
Bitcoin price declined today by around $1,000 within a period of around 24 hours to $16,033. Our technical analysis predicts that bitcoin price will continue on dropping to test the support level around $15,781.1 which represents the 23.6% Fibonacci retracement.
Chart from Bitfinex, hosted on Tradingview.com