Key Points
- Bitcoin price traded higher intraday, and it looks set for more gains in the near term.
- A break above the recent resistance area formed near $408 is possible, which might take the price towards the $420 level.
- There is a support trend line on the hourly chart (data feed from Bitstamp) formed that may be seen as a buy zone.
Bitcoin price is gaining pace, and if all goes well, there is a chance of it breaking $408 and testing the $420 resistance area.
Bitcoin Price- Buy with a break?
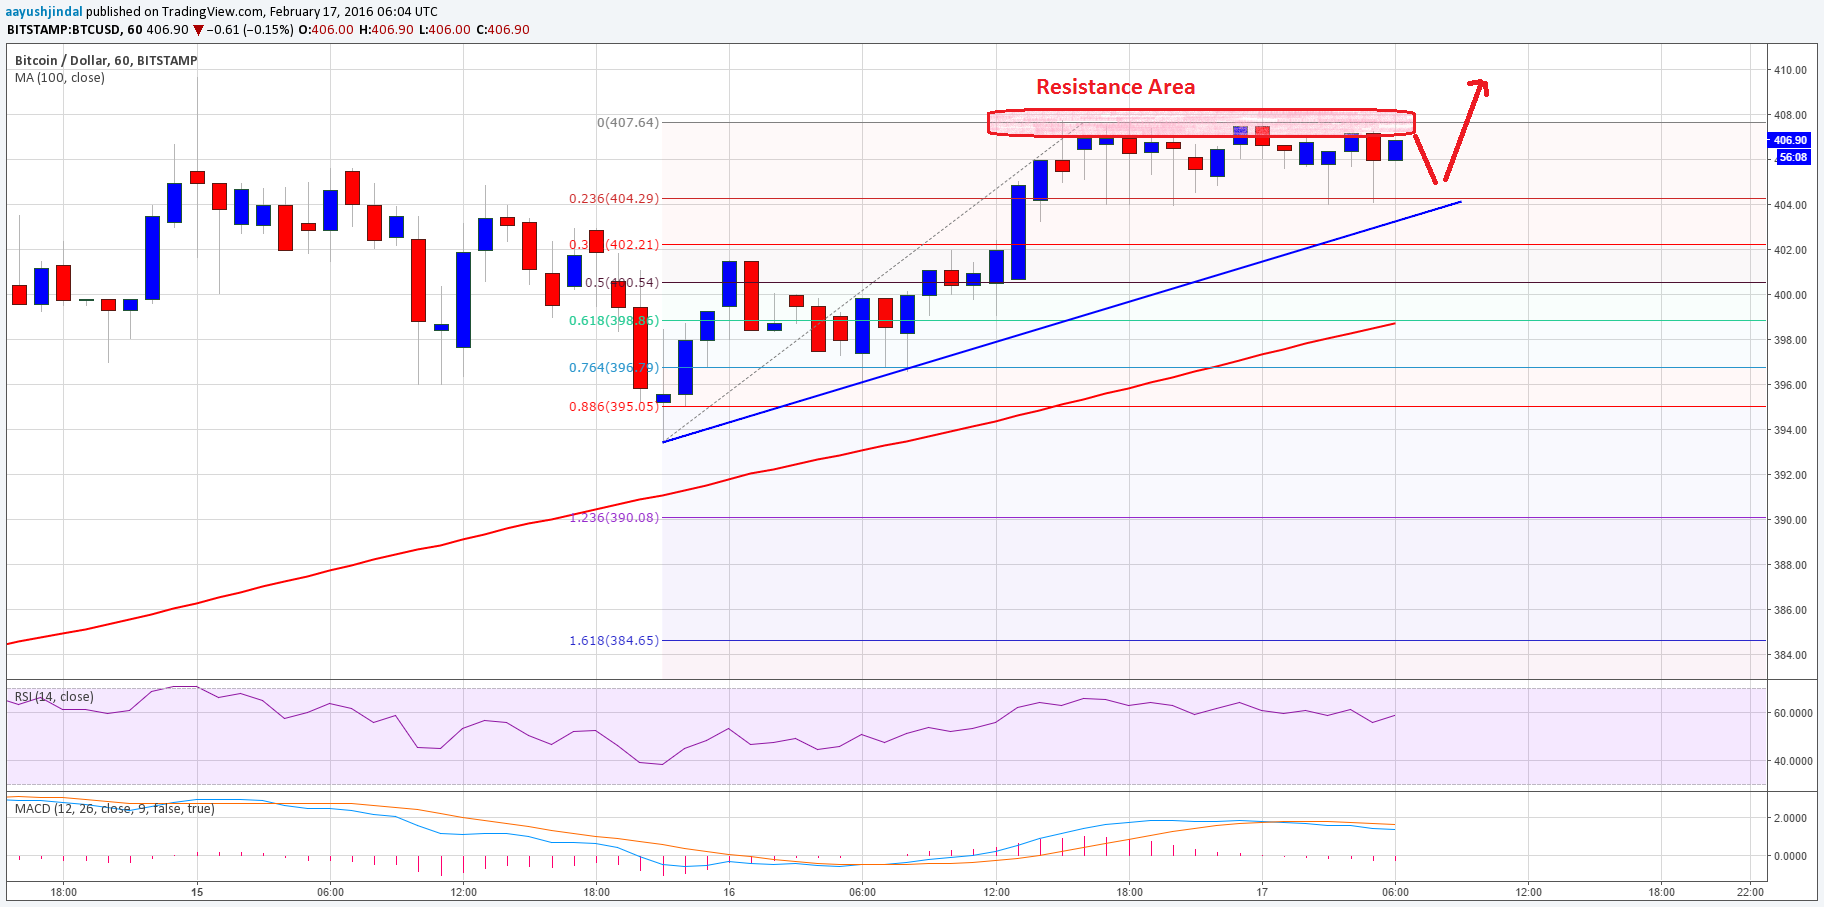
Bitcoin price as forecasted move higher and traded back above the $400 level. It is currently struggling to clear the $408 level, but there is a high probability that the bulls may clear it. There is a support trend line formed on the hourly chart (data feed from Bitstamp), which may play a major role in the near term. If the bulls manage to clear the $408 level, then the price may head towards the $420 level.
The stated level acted as a pivot area earlier, so it won’t be easy for the bulls to break. No doubt, there are a lot of positive signs for Bitcoin price, and if there is a move above $408, then it could open the doors for more gains. On the downside, there is a trend line as highlighted, which may act as a barrier for sellers. It is coinciding with the 23.6% Fib retracement level of the last leg from the $393 low to $408 high.
A break below the trend line and support area may be a bearish call. The price could head towards the 100 simple moving average (H2 chart, data feed from Bitstamp), as it is positioned with the 61.8% Fib retracement level of the last leg from the $393 low to $408 high.
Looking at the technical indicators:
Hourly MACD – The hourly MACD is about to change the slope to bullish, which is a positive sign.
RSI (Relative Strength Index) – The hourly RSI is above the 50 level, calling for more gains.
Intraday Support Level – $400
Intraday Resistance Level – $408
Charts from Bitstamp; hosted by Trading View


Leave a Reply
You must be logged in to post a comment.