Even though bitcoin price continued dropping during the beginning of last week to record a low of around $1828 on Bitfinex last Sunday, the downtrend was reversed shortly after breaking through the 50% Fibonacci retracement, which corresponds to the $1947.98 price level, and bitcoin price began rising again to $2,509 at the time of writing of this article.
The new bullish wave may be due to agreement of a large proportion of miners on BIP 91, which is a piece of code that signals for the Seqwit2x scaling proposal. At the time of writing of this article, 80.4% of the 336 blocks needed to lock in BIP 91 have been already produced. It seems that we are on the way for a BIP 91 lock, which signals for the Segwit2x, a scaling proposal that not only fixes transaction malleability, but also prevents splitting of the blockchain.
So, what do the charts tell us? Can we see bitcoin price continue rising during the upcoming week.
Kindly, refer to our previous analysis to get acquainted with our Fibonacci retracement placement.
About to Test the 23.6% Fibonacci Retracement:
By examining the 4 hour BTCUSD chart from Bitfinex, while keeping our Fibonacci retracement and plotting the Williams Alligator and MACD indicators and the Bollinger Bands (look at the below chart), we can conclude the following:
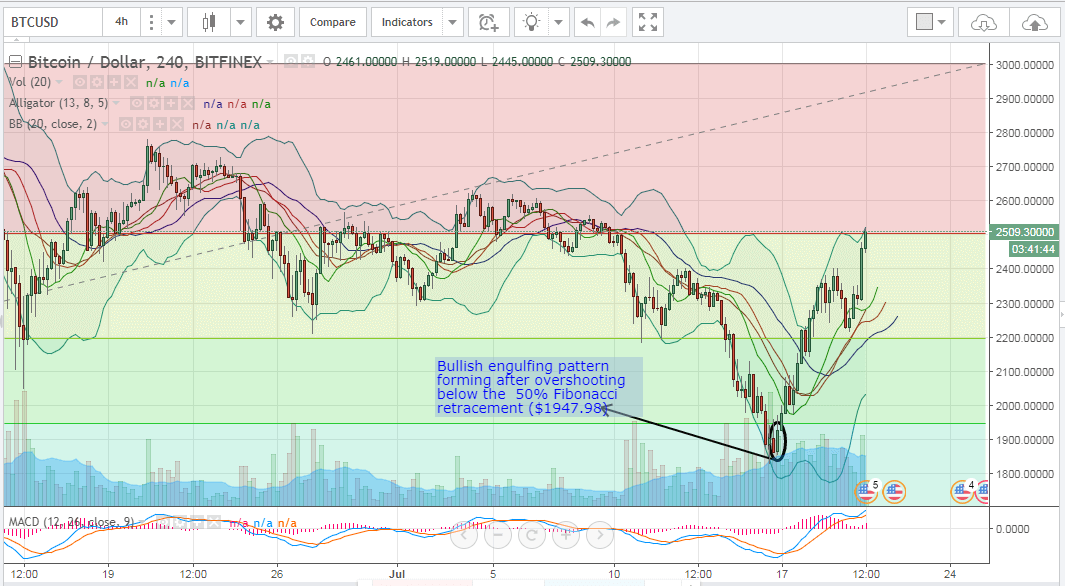
- In the beginning of the week, bitcoin price continued falling, until a week low of $1,828 was recorded last Sunday. As we can note on the below chart, a “bullish engulfing” pattern was formed and signaled reversal of the downtrend around 8 hours after dropping below the 50% Fibonacci retracement ($1,947.98).
- Right now, bitcoin price is testing the 23.6% Fibonacci retracement which corresponds to the $2,508.17 price level. The Williams Alligator’s SMAs are exhibiting a bullish alignment with the red SMA above the blue SMA and the green SMA is above both. Also, the MACD indicator is exhibiting a bullish signal with the blue positive trend line travelling above the red negative trend line and its value is in the positive territory. As such, conditions are favorable for continuation of the new bullish wave.
- The candlesticks are now touching the upper Bollinger Band, which reflects relative market instability at this price level (bitcoin is overbought), so we can expect to see a minor downwards price correction wave, before we can head North to higher levels.
Conclusion:
The downwards price movement was reversed last week and bitcoin price began rising again to reach $2,509 at the time of writing of this analysis. Our technical analysis predicts continuation of the new bullish wave, especially that it seems that BIP 91 will lock in to signal agreement on the Segwitx2 scaling proposal.
Chart from Bitfinex, hosted on Tradingview.com