
Bitcoin price surged last week to record a new historical high of around $4,983.2 on Bitfinex, as we expected during our previous weekly analysis, before a downwards price correction wave took the upper hand, pulling price down to $4,597, as this article is being written. Now, as a 5 wave Elliott formation has been formed on the 4 hour BTCUSD chart, where can we expect bitcoin price to be heading during the upcoming week?
5 Wave Elliott Formation Completed on the 4 Hour BTCUSD Chart:
Let’s examine the 4 hour BTCUSD chart from Bitfinex, while plotting the Williams Alligator and MACD indicators (look at the below chart). We can note the following:
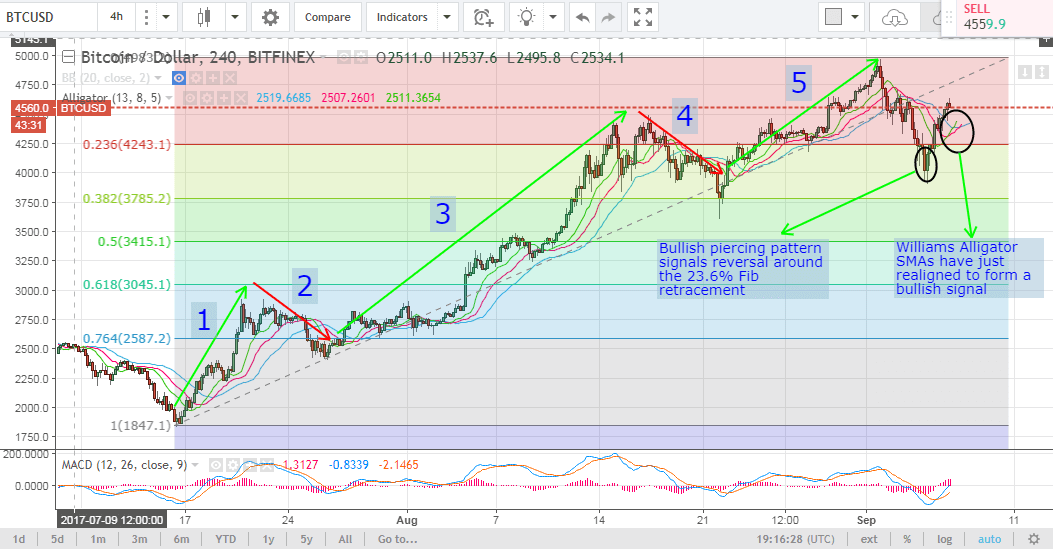
- We can now plot a Fibonacci retracement that extends between the low recorded on the 16th of July ($1,847.1) and the high recorded on the 2nd of September ($4,983.2) to identify key resistance and support points during this period. As we can note on the above chart, after overshooting slightly below the 23.6% Fib retracement, which corresponds to $4,243.1, the downwards price correction wave was reversed denoting the strong support around this critical price level. A bullish piercing pattern (the 2 candlesticks highlighted by an ellipse on the above chart) signaled reversal of the downwards price correction movement.
- As we expected during last week’s analysis, the last wave of the 5 wave Elliott formation has been formed during last week’s trading sessions scoring an all time high of $4,983.2. Right after the 5th wave was completed, a downwards price correction wave started pulling price down to the next support level around the 23.6% Fib retracement as traders and speculators started collecting their profits.
- We will most likely see bitcoin price rise again to test the resistance around the $4,983.2 level during the upcoming week, especially that the Williams Alligator’s SMAs have just realigned to exhibit a bullish signal. Also, the MACD indicator is sloping in an upwards direction and the blue positive trend line is above the red negative trend line, which confirms the upwards price movement during the upcoming week or so, especially that it’s value is heading towards the positive territory.
- Mostly, price will rise to test the resistance around $4,983.2 then drop towards the 23.6% Fib retracement around $4,243.1 multiple times during the upcoming 1-2 weeks before we can see a breakout in either direction.
Conclusion:
Bitcoin price surged to score a new histrocial high last week of $4,983.2, before dropping down to the next support level around $4,243.1, which corresponds to the 23.6% Fib retracement. Our technical analysis is in favor of a price surge to test the resistance around $4,983.2 again during the upcoming week, before dropping down again towards the 23.6% Fib retracement.
Chart from Bitfinex, hosted on Tradingview.com


Leave a Reply
You must be logged in to post a comment.