
BNB 2026 price outlook tracks $594 price action, lost $627 support, 36.25 RSI, and $11.85M in 24-hour long liquidations.
BNB price outlook has turned cautious after BNB USDT fell near $594 on the daily Binance chart.
The move has raised a key question for traders. It asks whether 2026 may offer another deep dip soon, or whether current levels may later look rare.
What If $BNB Never Trades This Low Again In 2026?
BNB moved below the $627.35 Fibonacci level, which had served as a major support area.
The price action showed short-term weakness, as sellers kept control during the latest daily session.
The chart placed the recent high near $1,324.32 before the broad retracement.
After that decline, $627 became an important level for BNB USDT traders watching the 2026 price structure.
What If $BNB Never Trades This Low Again In 2026? pic.twitter.com/wkC1RKTBt9
— Crypto Patel (@CryptoPatel) June 4, 2026
BNB now needs to recover the $627 to $650 zone to ease selling pressure. A daily close above that range could support a move toward $700 and $720.
If BNB fails to regain $627, lower support areas may receive more attention. The next zones on the chart sit near $575, $550, and the wider $500 level.
BNB Price Faces Key Recovery Levels
The Fibonacci chart shows several resistance levels above the current BNB price. These levels include $776.50, $893.59, $975.83, $1,058.08, and $1,159.84.
A stronger recovery would require BNB to reclaim $627 first. After that, the 0.786 Fibonacci level near $776.50 would become the next major test.
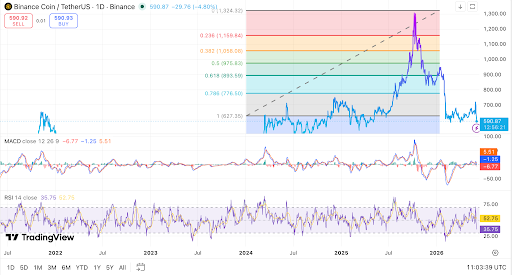
The RSI stood near 36.25 on the daily chart. This reading showed weak momentum, although it did not confirm oversold conditions.
A move above the 45 to 50 RSI range would show better buyer activity. A fall below 30 would move BNB closer to oversold territory.
The MACD also remained weak, with the MACD line below the signal line. This setup showed that bearish momentum was still present on the daily timeframe.
Read Also:
BNB Returns To Eight Year Support Line As Traders Watch Major Cycle Base Test
Long Traders Remain Exposed After Liquidations
Derivatives data showed that many accounts still favored long positions despite the latest decline.
Binance BNB/USDT accounts showed a long short ratio of 2.7793. OKX BNB accounts showed a long short ratio of 2.01.
Binance top trader accounts recorded 2.7258, while top trader positions stood at 1.3825.
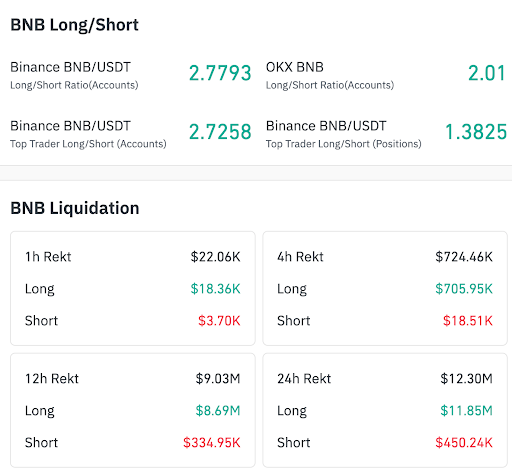
Liquidation data showed that long traders carried most of the recent losses. BNB recorded $12.30 million in 24-hour liquidations, with $11.85 million from longs.
Short liquidations stood at $450.24K during the same 24-hour period. Long liquidations therefore formed more than 96% of the total daily figure.
The 12-hour liquidation total reached $9.03 million, with $8.69 million from long positions. The 4-hour total reached $724.46K, with $705.95K from longs.
The 1-hour total cooled to $22.06K, showing that the largest liquidation wave had slowed. Market focus remains on whether BNB can reclaim $627 or retest lower support.


Leave a Reply
You must be logged in to post a comment.