- ADA price started a fresh decline from the $1.35 resistance against the US Dollar.
- The price is now trading below $1.20 and the 55 simple moving average (4-hours).
- There is a major bearish trend line forming with resistance near $1.165 on the 4-hours chart (data feed via Bitfinex).
- The price might start a fresh increase if it manages to clear the $1.20 resistance zone.
Cardano price is struggling below the $1.20 resistance against the US Dollar, unlike bitcoin. ADA price must clear $1.20 to start a fresh increase.
Cardano Price Analysis
This week, cardano price saw a fresh decline below the $1.25 zone against the US Dollar. The ADA/USD pair traded below the $1.20 support level to enter a bearish zone.
The bears gained strength for a move below the $1.15 level and the 55 simple moving average (4-hours). A low was formed near $1.070, and the price is now correcting losses. There was a move above the $1.10 resistance zone.
The bulls pushed the price above the 23.6% Fib retracement level of the downward move from the $1.390 swing high to $1.070 low. It is now facing resistance near the $1.165 level.
There is also a major bearish trend line forming with resistance near $1.165 on the 4-hours chart. The next key resistance is near the $1.200 level, followed by $1.23. The 50% Fib retracement level of the downward move from the $1.390 swing high to $1.070 low is also near the $1.23.
A clear break above the $1.23 resistance could pump the price towards the $1.30 level. Any more gains could push the price towards the $1.35 level.
On the downside, an immediate support is near the $1.125 level. The first major support is near $1.10. Any more losses might lead the price towards the $1.07 level, below which the bears could gain strength in the near term. In the stated case, the price could revisit $1.00.
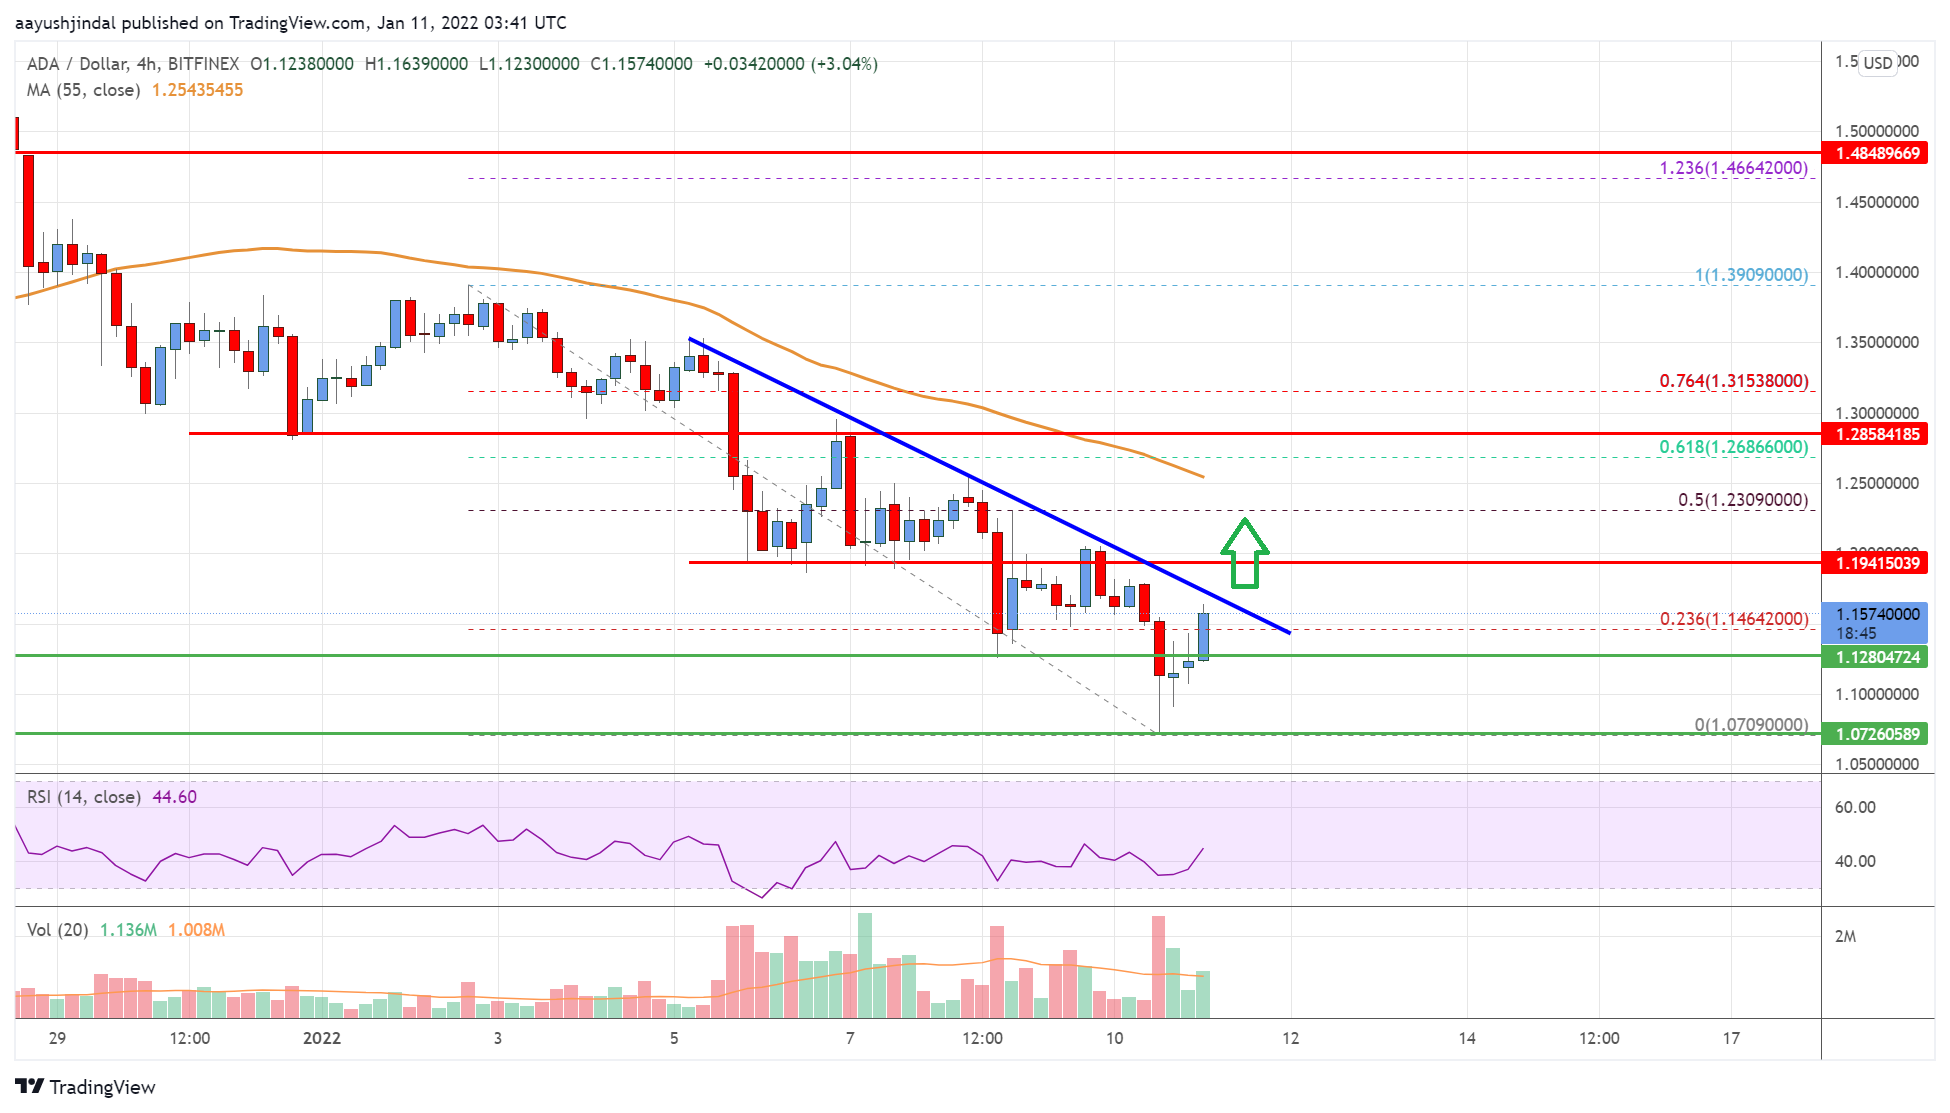
The chart indicates that ADA price is now trading below $1.20 and the 55 simple moving average (4-hours). Overall, the price might start a fresh increase if it manages to clear the $1.20 resistance zone.
Technical Indicators
4 hours MACD – The MACD for ADA/USD is now moving in the bullish zone.
4 hours RSI – The RSI for ADA/USD is now approaching the 50 level.
Key Support Levels – $1.12 and $1.070.
Key Resistance Levels – $1.20 and $1.23.
