- ADA price is struggling to clear the $2.30 and $2.32 resistance levels against the US Dollar.
- The price is now trading near $2.20 and the 55 simple moving average (4-hours).
- There is a key contracting triangle forming with resistance near $2.26 on the 4-hours chart (data feed via Bitfinex).
- The price might start a steady increase if there is a close above $2.30 and $2.32.
Cardano price is struggling below the $2.40 resistance against the US Dollar, unlike bitcoin. ADA price must clear $2.32 to start a fresh increase.
Cardano Price Analysis
After a sharp decline, cardano price found support near $2.02 against the US Dollar. The ADA/USD pair started a decent increase and cleared the $2.10 resistance level.
There was a break above the $2.20 resistance and the 55 simple moving average (4-hours). The price climbed above the 50% Fib retracement level of the downward move from the $2.45 swing high to $2.02 swing low.
The price even spiked above the $2.30 level, but the bulls struggled near $2.32. ADA failed to settle above the 61.8% Fib retracement level of the downward move from the $2.45 swing high to $2.02 swing low. It is now trading near $2.20 and the 55 simple moving average (4-hours).
An initial resistance on the upside is near the $2.24 level. The first major resistance is forming near the $2.25 level. There is also a key contracting triangle forming with resistance near $2.26 on the 4-hours chart.
The main resistance is near the $2.32 level. If there is an upside break above the $2.32 zone, the price could rally above $2.50. The next major resistance could be near the $2.80 level.
On the downside, an immediate support is near the $2.15 level. The first major support is near $2.12 and the triangle lower trend line. Any more losses might lead the price towards the $2.02 level. The main support sits near the $2.00 level.
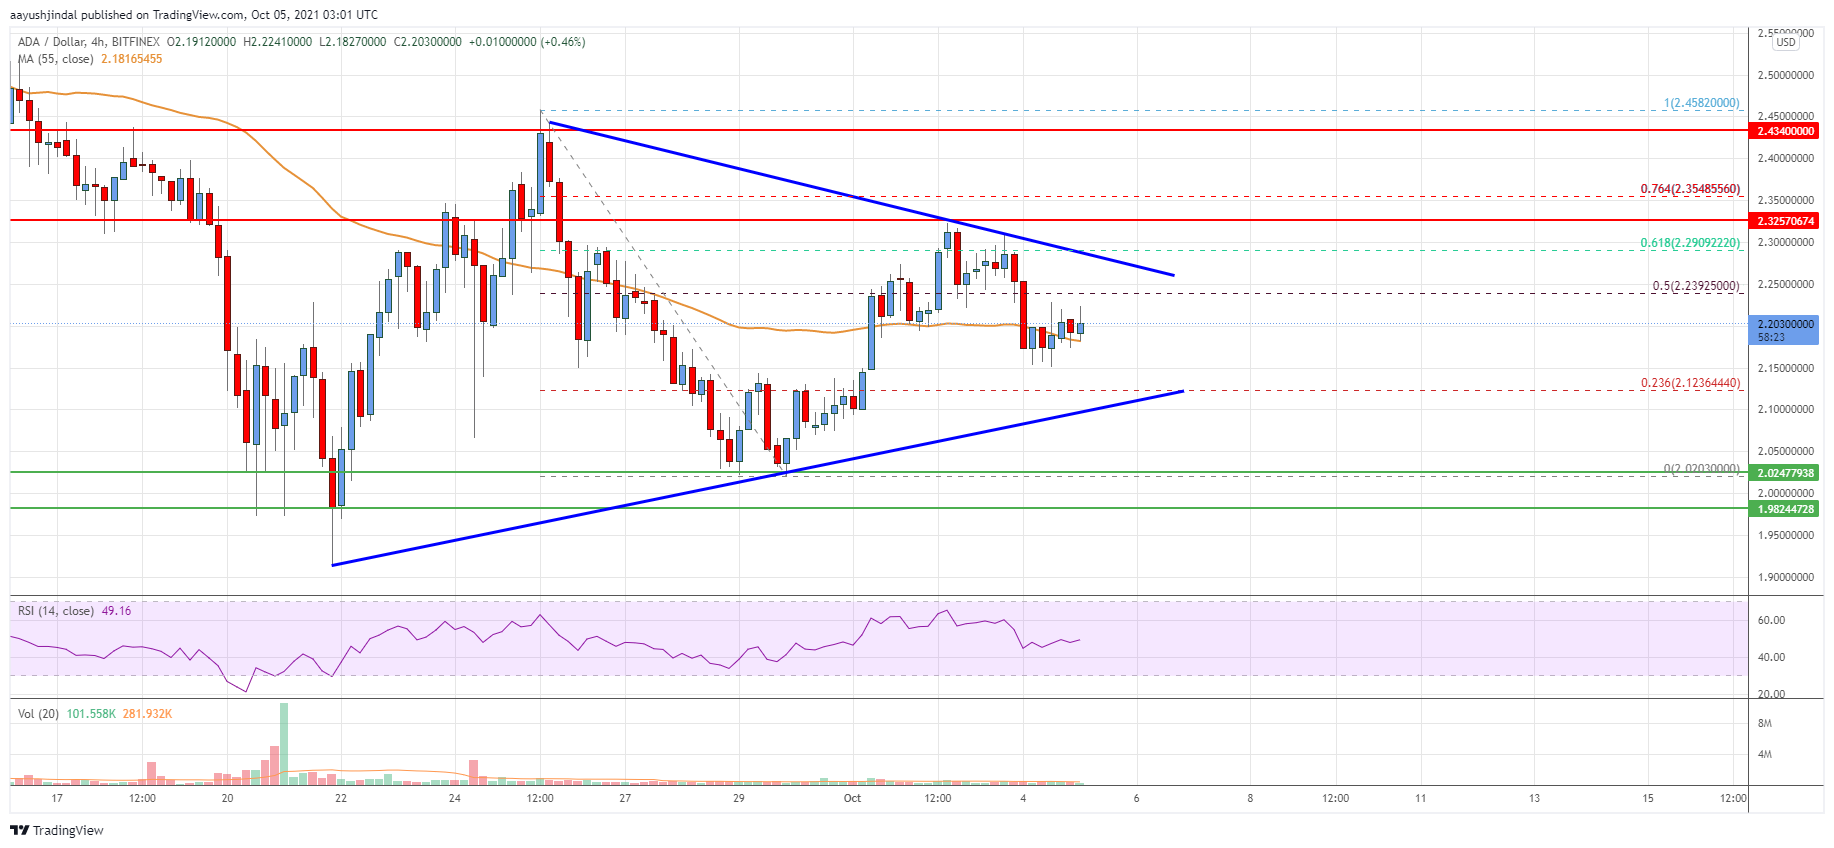
The chart indicates that ADA price is now trading near $2.20 and the 55 simple moving average (4-hours). Overall, the price might start a steady increase if there is a close above $2.30 and $2.32.
Technical Indicators
4 hours MACD – The MACD for ADA/USD is slowly moving into the bearish zone.
4 hours RSI – The RSI for ADA/USD is just above the 50 level.
Key Support Levels – $2.12 and $2.02.
Key Resistance Levels – $2.25 and $2.32.
