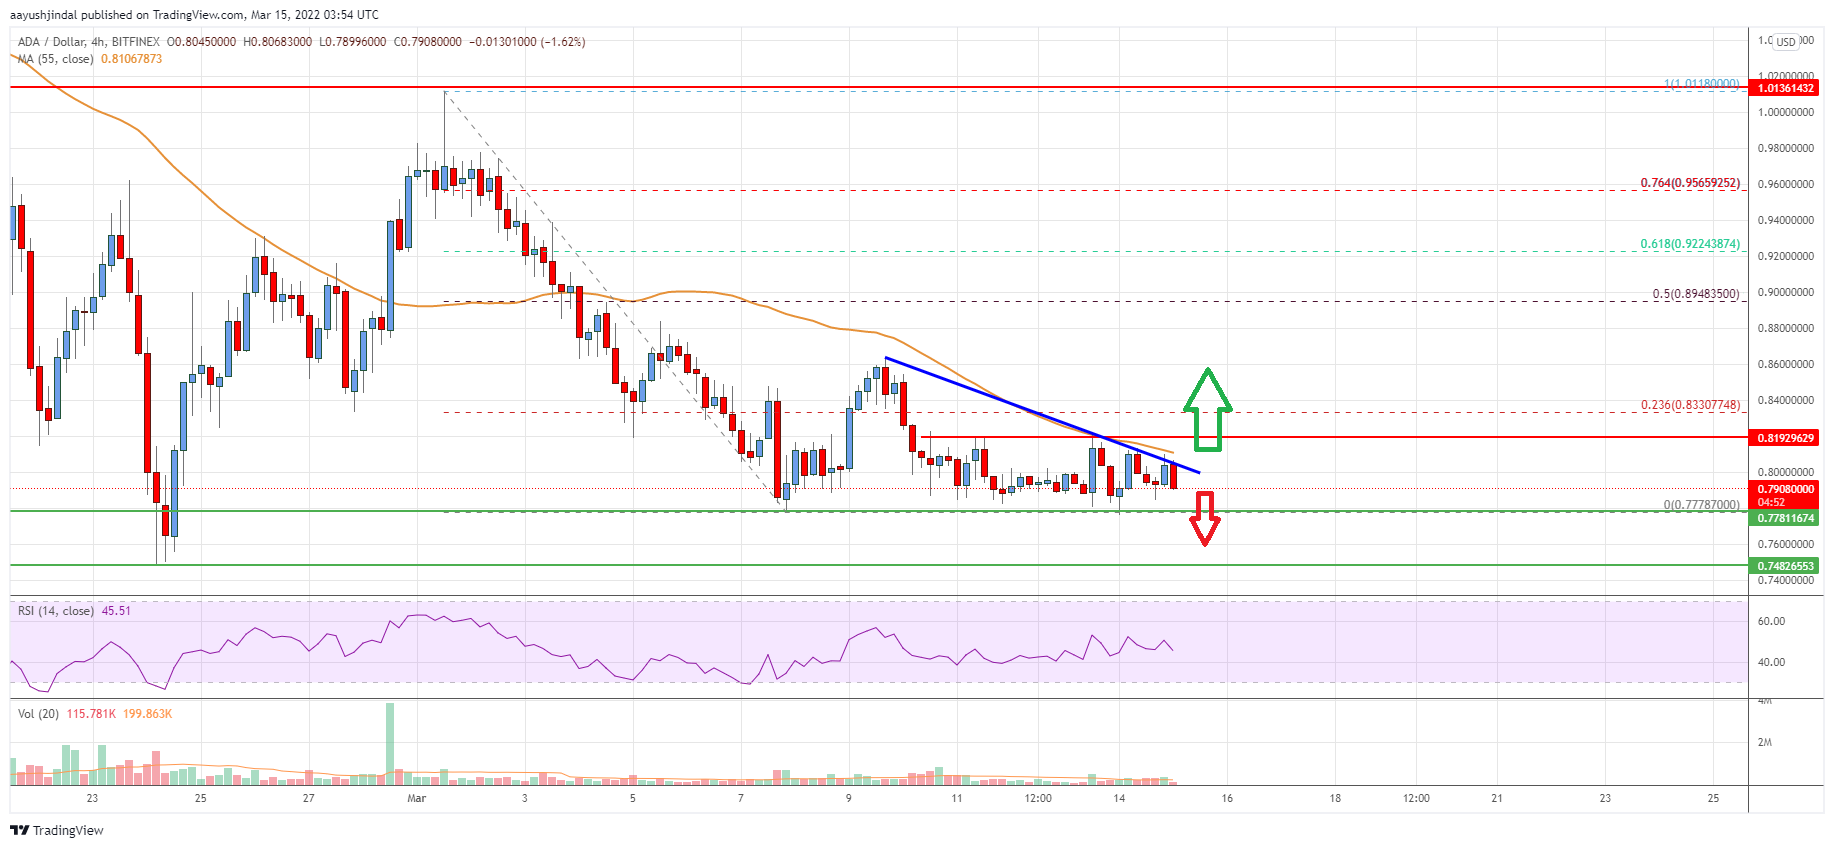
- ADA price declined below $0.85 and $0.82 against the US Dollar.
- The price is now trading below $0.82 and the 55 simple moving average (4-hours).
- There is a key bearish trend line forming with resistance near $0.800 on the 4-hours chart (data feed via Bitfinex).
- The price could start a recovery wave if there is a move above $0.820 and $0.833.
Cardano price is struggling below $0.85 against the US Dollar, similar to bitcoin. ADA price could start a recovery wave if there is a move above the $0.833 resistance.
Cardano Price Analysis
This week, cardano price saw a fresh decline from well above the $0.85 zone against the US Dollar. The ADA/USD pair broke the $0.82 and $0.80 support levels to move into a bearish zone.
There was a close below the $0.82 level and the 55 simple moving average (4-hours). Finally, the price dipped below $0.80 and traded as low as $0.778. It is now consolidating losses and trading near $0.790. An immediate resistance on the upside is near the $0.800 level.
There is also a key bearish trend line forming with resistance near $0.800 on the 4-hours chart. The first key resistance might be near the $0.833 level. It is near the 23.6% Fib retracement level of the downward move from the $1.011 high to $0.778 low.
A clear upside break above the $0.833 level might send the price towards the $0.850 resistance. The next key resistance might be near the $0.890 level.
The 50% Fib retracement level of the downward move from the $1.011 high to $0.778 low is also near $0.890. Any more gains could start a steady increase towards $0.95. On the downside, an immediate support is near the $0.780 level.
The first major support is near $0.750. Any more losses might lead the price towards the $0.72 level. A break below $0.72 could push the price towards the $0.65 level.

The chart indicates that ADA price is now trading below $0.82 and the 55 simple moving average (4-hours). Overall, the price could start a recovery wave if there is a move above $0.820 and $0.833.
Technical Indicators
4 hours MACD – The MACD for ADA/USD is now losing pace in the bearish zone.
4 hours RSI – The RSI for ADA/USD is now below the 50 level.
Key Support Levels – $0.78 and $0.75.
Key Resistance Levels – $0.833 and $0.850.


Leave a Reply
You must be logged in to post a comment.