- ADA price started a fresh increase after it tested the $1.10 support zone against the US Dollar.
- The price is still trading well below $1.75 zone and the 55 simple moving average (4-hours).
- There was a break above a major bearish trend line with resistance near $1.48 on the 4-hours chart (data feed via Bitfinex).
- The price could correct further lower, but the bulls are likely to remain active near $1.400 and $1.350.
Cardano price is facing a major barrier near the $1.700 zone against the US Dollar, similar to bitcoin. ADA price could revisit $1.350 before starting a fresh increase.
Cardano Price Analysis
There was an extended drop in cardano price below the $1.75 and $1.50 support levels against the US Dollar. The ADA/USD pair even broke the $1.350 support level and the 55 simple moving average (4-hours).
There was a spike below the $1.20 level, but the bulls were active above the $1.10 level. A low was formed near $1.070 before the price started a fresh increase. The price was able to recover above the $1.20 and $1.25 resistance levels.
There was also a break above a major bearish trend line with resistance near $1.48 on the 4-hours chart. The pair climbed above the 50% Fib retracement level of the recent decline from the $1.950 swing high to $1.070 low.
However, the price is still trading well below $1.75 zone and the 55 simple moving average (4-hours), It is facing hurdles near the 61.8% Fib retracement level of the recent decline from the $1.950 swing high to $1.070 low. The first major resistance is near the $1.675 and $1.700 levels.
The main resistance is near the $1.750 level and the 55 SMA. A close above $1.70 and $1.75 might pump the price back towards the $2.00 level.
On the downside, an intermediate support could be $1.450. The main support sits at $1.350, below which the price could dive towards the $1.100 level.
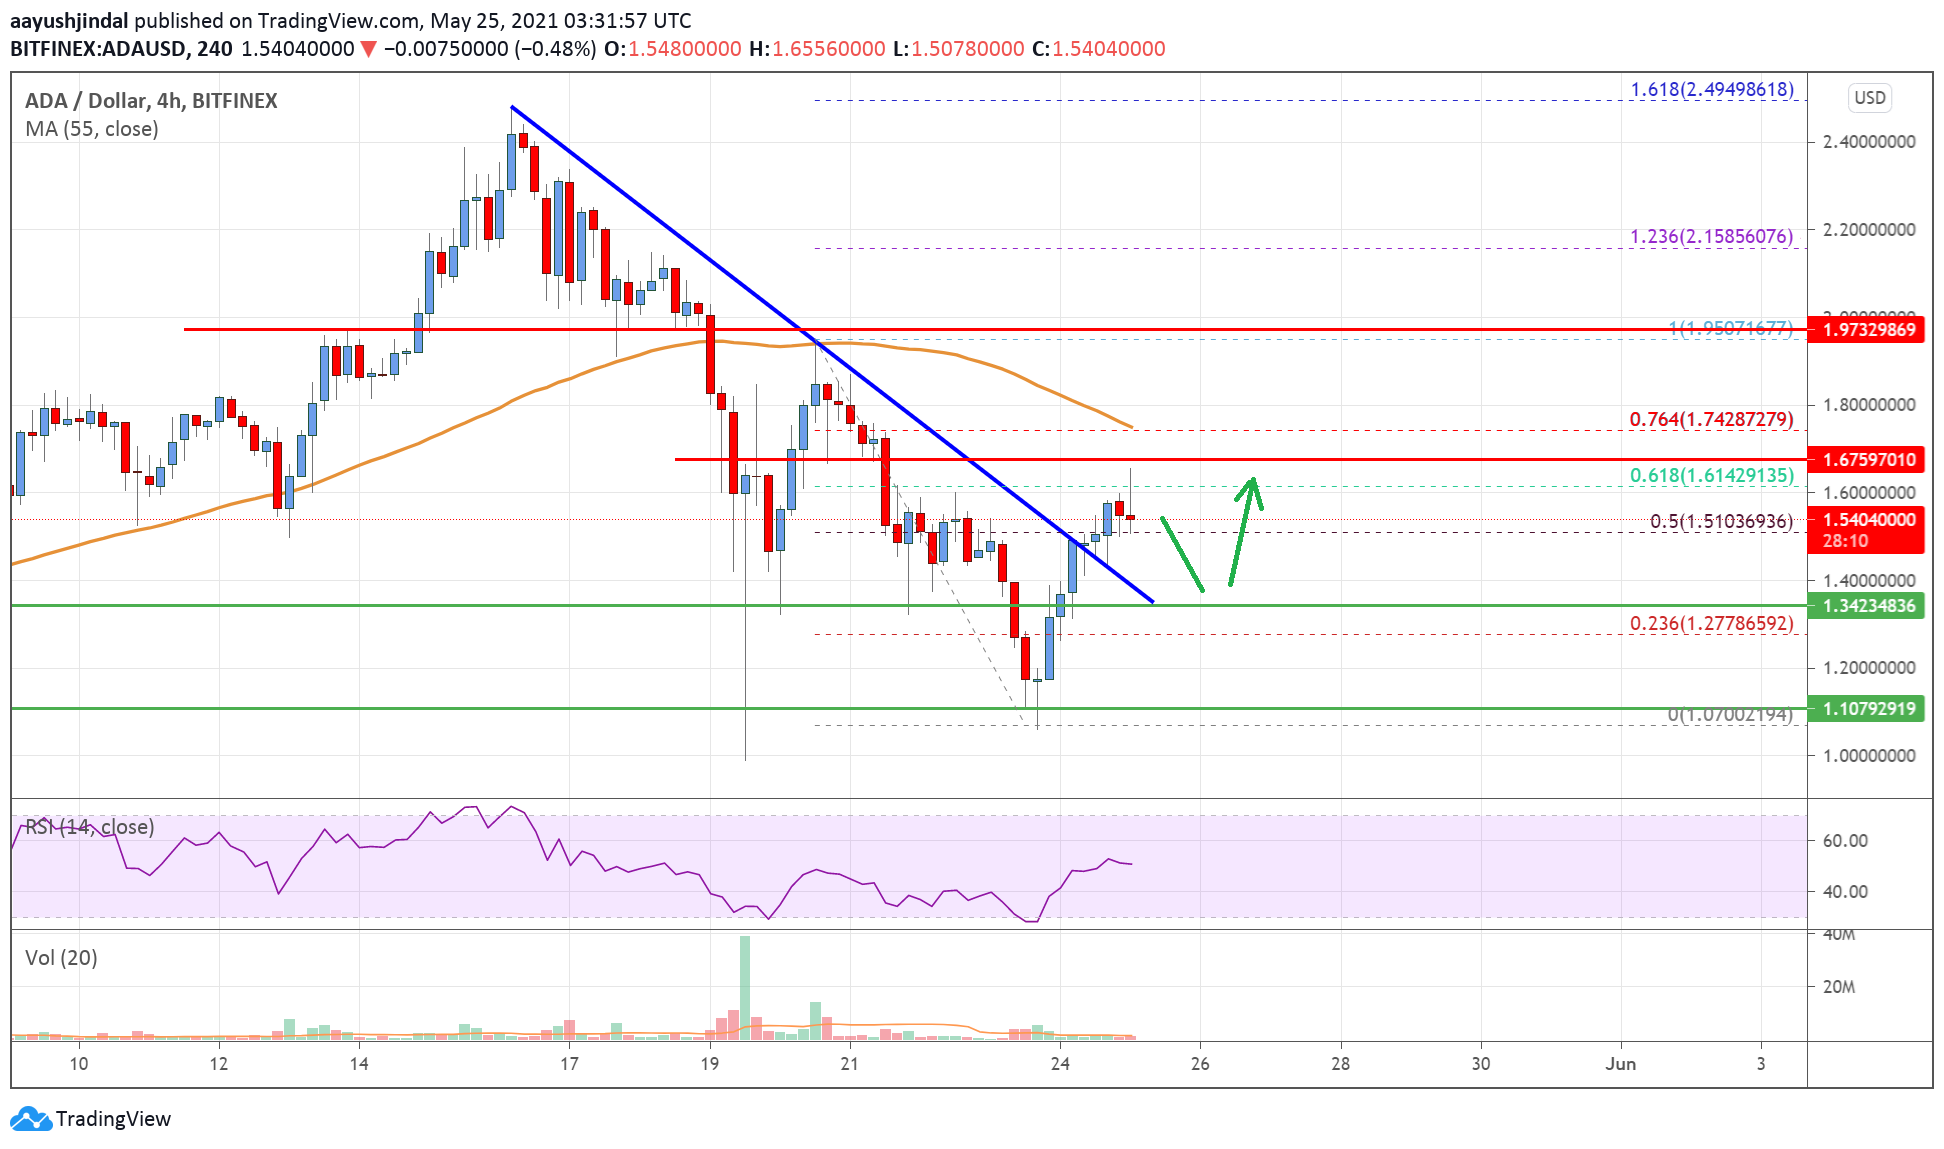
The chart indicates that ADA price is clearly trading well below $1.750 support and the 55 simple moving average (4-hours). Overall, the price could correct further lower, but the bulls are likely to remain active near $1.400 and $1.350.
Technical Indicators
4 hours MACD – The MACD for ADA/USD is now losing pace in the bullish zone.
4 hours RSI – The RSI for ADA/USD is now close to the 50 level.
Key Support Levels – $1.400 and $1.350.
Key Resistance Levels – $1.700 and $1.750.
