- ADA price is back in a bearish zone below the key $0.0400 support area against the US Dollar.
- The price is likely to extend its decline towards the $0.0375 or $0.0360 support.
- There was a break below a major bullish trend line with support near $0.0408 on the 4-hours chart (data feed via Kraken).
- The price could correct a few points, but the previous support near $0.0408 might prevent gains.
Cardano price is currently declining against the US Dollar and bitcoin. ADA price remains at a risk of more losses towards $0.0375 or even $0.0360 in the near term.
Cardano Price Analysis
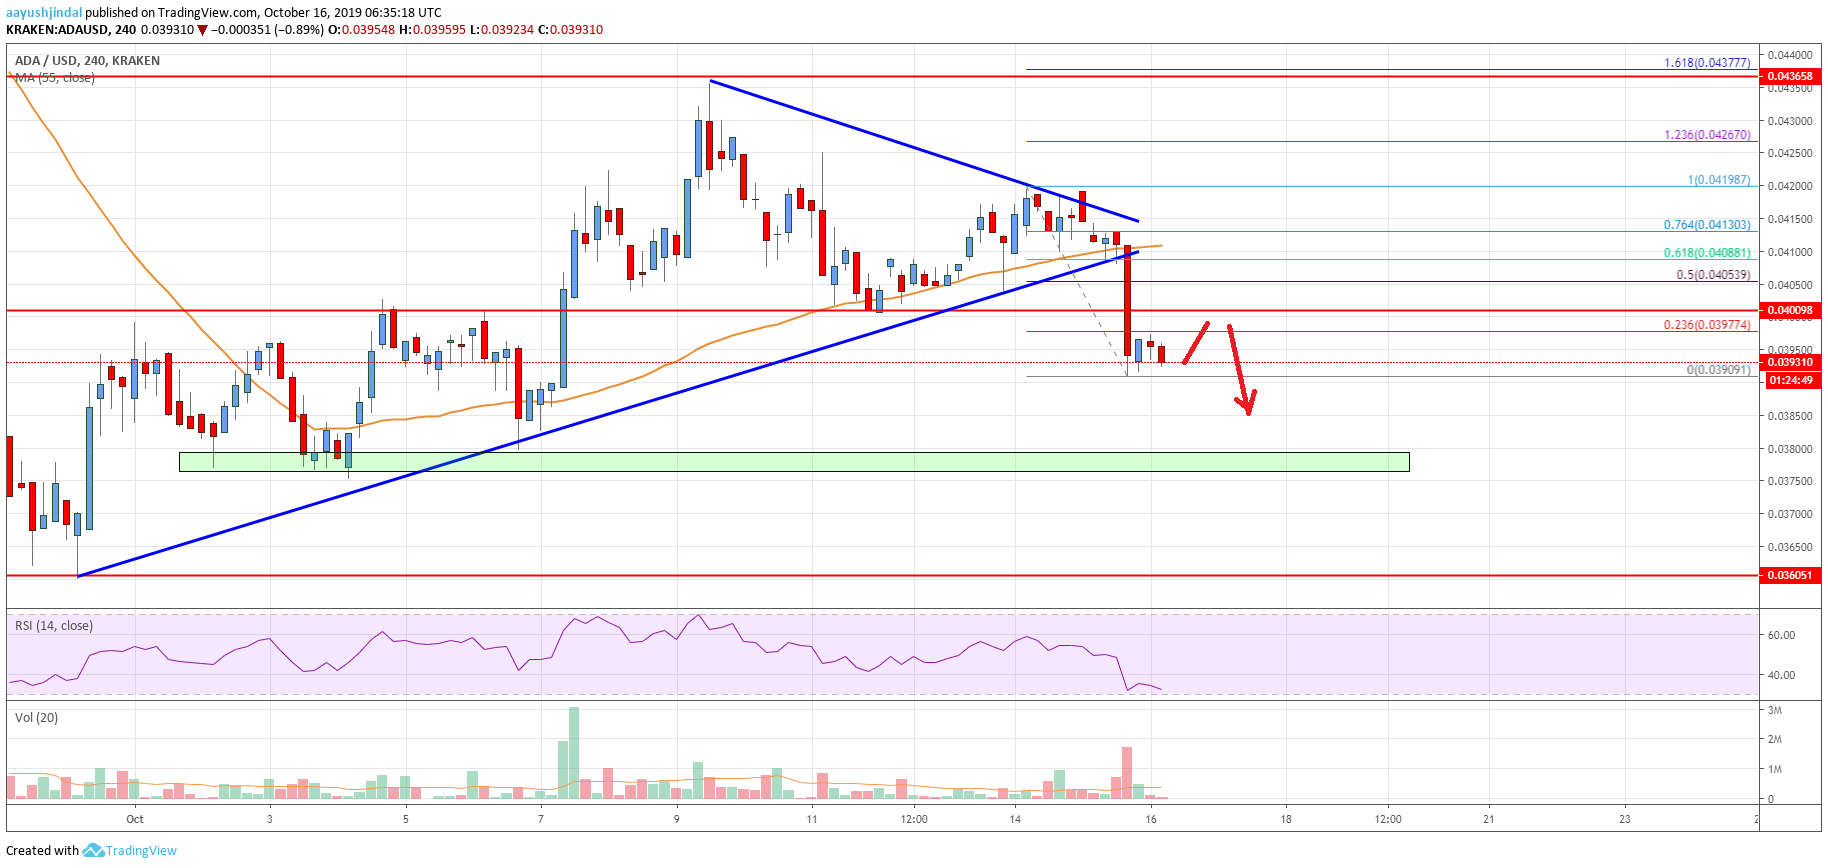
This past week, there was a decent rise in cardano price above the $0.0400 resistance against the US Dollar. Moreover, the ADA/USD pair traded above the $0.0420 resistance and the 55 simple moving average (4-hours). Finally, the price spiked above $0.0430 and traded to a new monthly high at $0.0437. Later, the price struggled to continue higher, resulting in a fresh decline below the $0.0420 support area.
Moreover, there was a break below a major bullish trend line with support near $0.0408 on the 4-hours chart. The pair is now trading well below the $0.0400 support and the 55 simple moving average (4-hours). It traded as low as $0.0390 and is consolidating losses. An immediate resistance is near the $0.0398 level. It coincides with the 23.6% Fibonacci retracement level of the recent decline from the $0.0419 high to $0.0390 low.
The first major resistance is near the $0.0400 level. The next resistance is near the $0.0405 since it coincides with the 50% Fibonacci retracement level of the recent decline from the $0.0419 high to $0.0390 low. The main resistance for cardano is near the $0.0408 level since it coincides with the 55 simple moving average (4-hours). Therefore, a successful break above $0.0400 and $0.0408 is must for a fresh increase.
On the downside, a break below the $0.0390 low could push the price towards the $0.0375 support area. Any further downsides might lead the price towards the $0.0360 support area in the coming sessions.

The chart indicates that ADA price is trading in a bearish zone below the $0.0408 and $0.0400 levels. There are high chances of more losses towards the key $0.0375 support area. Conversely to start a fresh increase, the price must climb above the $0.0408 resistance and the 55 simple moving average (4-hours).
Technical Indicators
4 hours MACD – The MACD for ADA/USD is currently gaining momentum in the bearish zone.
4 hours RSI – The RSI for ADA/USD is currently well below the 40 level, with a bearish angle.
Key Support Levels – $0.0375 and $0.0360.
Key Resistance Levels – $0.0400 and $0.0408.


Leave a Reply
You must be logged in to post a comment.