- ADA price is up over 20% and it broke the key $0.1000 resistance area against the US Dollar.
- The price traded close to the $0.1400 level and it is currently consolidating gains.
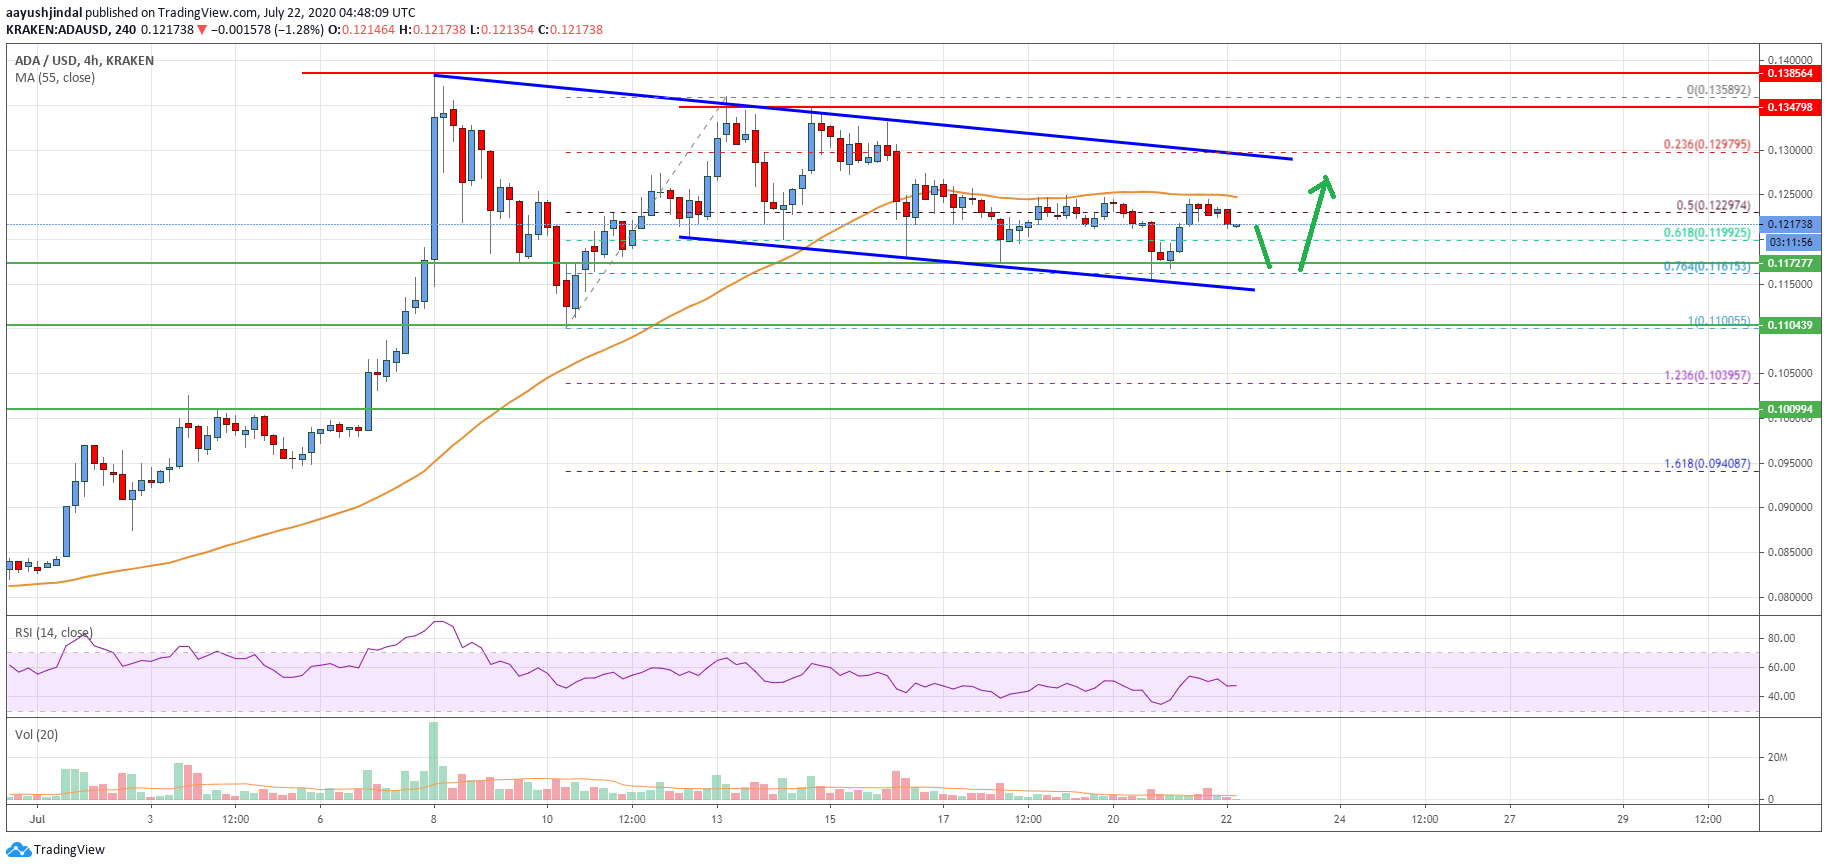
- There is a major bullish trend line forming with support near $0.1100 on the 4-hours chart (data feed via Kraken).
- The price could correct a few points, but dips remain well supported on the downside at $0.1200.
Cardano price is gaining bullish momentum against the US Dollar and bitcoin. ADA price surged more than 20% and it seems like the bulls are aiming a test of $0.1500.
Cardano Price Analysis
Recently, cardano price broke a significant resistance at $0.1000 to move into a positive zone against the US Dollar. The ADA/USD pair gained traction above the $0.1200 level the 55 simple moving average (4-hours).
The price is up over 20% today and it even spiked above the $0.1300 level. A new monthly high is formed near $0.1385 and the price is currently consolidating gains. It already tested the 23.6% Fibonacci retracement level of the recent rally from the $0.0944 low to $0.1385 high.
On the downside, there are many supports, starting with the $0.1250 level. The first major support is near the $0.1200 level. The 50% Fibonacci retracement level of the recent rally from the $0.0944 low to $0.1385 high is also near $0.1165.
More importantly, there is a major bullish trend line forming with support near $0.1100 on the 4-hours chart. It seems like there is a strong support base forming near $0.1000 level (the breakout zone) and it is trading well above the 55 simple moving average (4-hours).
Therefore, the price is likely to continue higher above the $0.1350 and $0.1380 levels. If there is a successful close above the $0.1380 level, the price could continue to rise. The next key resistance is near the $0.1400 level, above which the price could rally towards the $0.1500 level.

The chart indicates that ADA price is clearly trading with a strong bullish bias above $0.1000 and $0.1200. Overall, the price could correct a few points, but dips remain well supported on the downside at $0.1200.
Technical Indicators
4 hours MACD – The MACD for ADA/USD is currently gaining traction in the bullish zone.
4 hours RSI – The RSI for ADA/USD is in the overbought zone.
Key Support Levels – $0.1200 and $0.1165.
Key Resistance Levels – $0.1380 and $0.1400.


Leave a Reply
You must be logged in to post a comment.