
- ADA price is currently recovering from the $0.0184 yearly low against the US Dollar.
- The price is trading above the $0.0200 and $0.0240 resistance levels.
- There was a break above a key bearish trend line with resistance near $0.0255 on the 4-hours chart (data feed via Kraken).
- The price could correct further higher in the short term, but it is likely to face hurdles near $0.0300.
Cardano price is currently staging a decent upside correction against the US Dollar and bitcoin. However, ADA price is likely to struggle near the $0.0300 resistance area.
Cardano Price Analysis
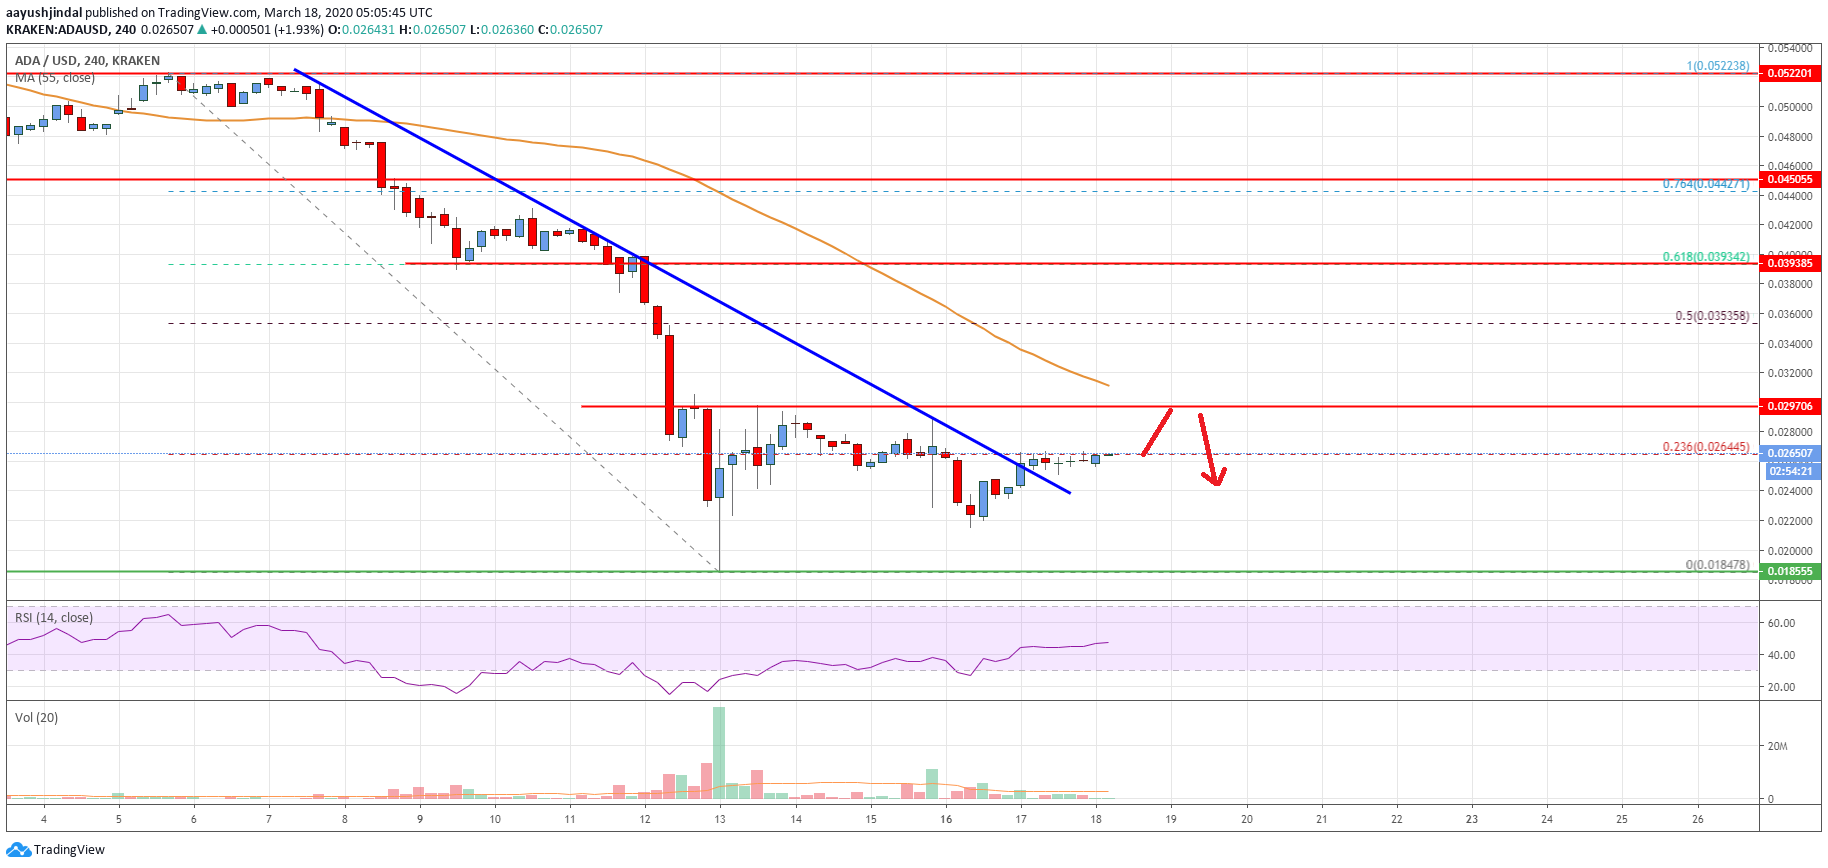
This past week, cardano price extended its decline below the $0.0400 and $0.0300 support levels against the US Dollar. The ADA/USD pair even broke the $0.0240 support and settled well below the 55 simple moving average (4-hours).
Finally, there was a spike below the $0.0200 support and the price traded to a new 2020 low at $0.0184. It is currently correcting higher and trading above the $0.0220 and $0.0240 resistance levels.
Moreover, there was a break above a key bearish trend line with resistance near $0.0255 on the 4-hours chart. The pair is now trading near the 23.6% Fibonacci retracement level of the main drop from the $0.0522 high to $0.0184 low.
An initial resistance on the upside is near the $0.0280 level. The first key resistance for cardano price is near the $0.0300 level (the previous breakdown zone).
Above the $0.0300 resistance, the price could test the $0.0320 resistance and the 55 simple moving average (4-hours). Any further gains could lead the price towards the 50% Fibonacci retracement level of the main drop from the $0.0522 high to $0.0184 low.
Conversely, the price could fail to continue above the $0.0300 resistance area or the 55 SMA. In the stated case, the price is likely to start a fresh decline below the $0.0240 and $0.0220 support levels.
The main support is near the $0.0200 level, below which the bears are likely to aim more losses below the $0.0184 low in the near term.
The chart indicates that ADA price is clearly correcting above the $0.0250 resistance area. However, the $0.0300 resistance area is likely to act as a massive hurdle. The price could either convincingly surpass the $0.0300 resistance or it might start a fresh decline to $0.0200.
Technical Indicators
4 hours MACD – The MACD for ADA/USD is currently gaining momentum in the bullish zone.
4 hours RSI – The RSI for ADA/USD is correcting higher towards the 50 level.
Key Support Levels – $0.0220 and $0.0200.
Key Resistance Levels – $0.0300 and $0.0320.


Leave a Reply
You must be logged in to post a comment.