- Bitcoin price is currently correcting losses from the $3,860 low against the US Dollar.
- It is trading in a range above the $4,440 support and below the $5,965 resistance.
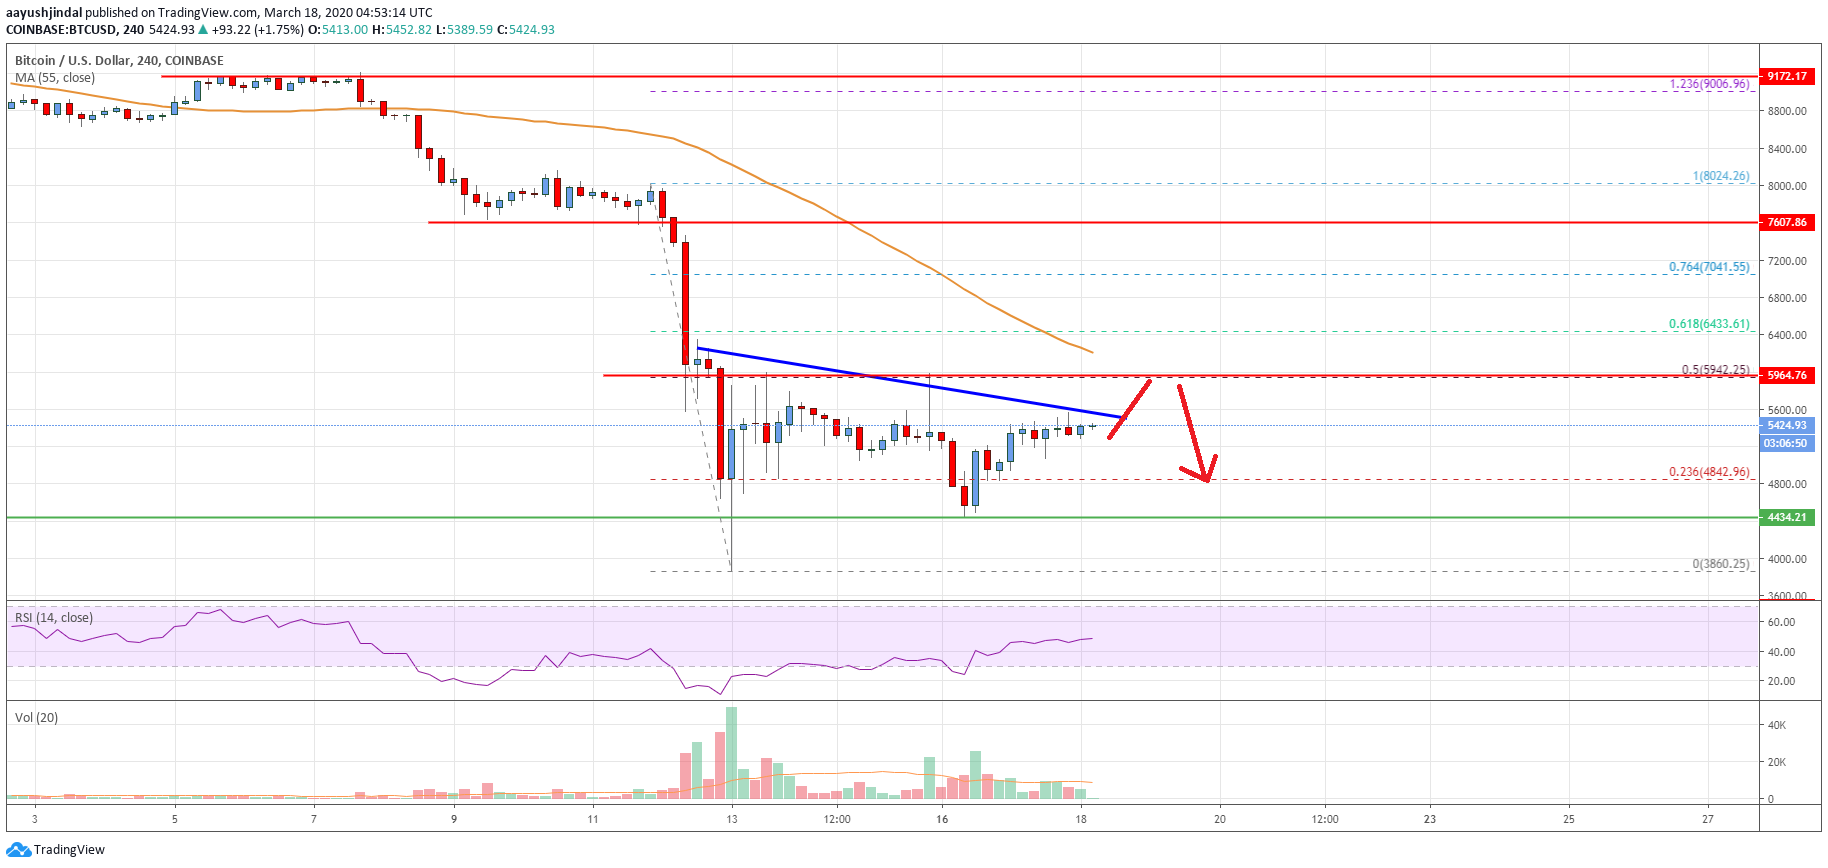
- There is a key bearish trend line forming with resistance near $5,520 on the 4-hours chart of the BTC/USD pair (data feed from Coinbase).
- The pair could correct higher, but it is likely to face a lot of hurdles near $5,965 and $6,000.
Bitcoin price is showing a few recovery signs above $5,000 against the US Dollar. However, BTC is likely to struggle near the $6,000 resistance area, above which it could rally sharply.
Bitcoin Price Analysis
This past week, there was a significant decline in bitcoin price below the $5,000 support against the US Dollar. BTC even declined below the $4,400 support and settled well below the 55 simple moving average (4-hours).
The decline was such that the price spiked below the $4,000 level. A new 2020 low is formed near the $3,860 level and the price recently started an upside correction. It managed to recover above the $4,200 and $4,450 levels.
Moreover, there was a break above the 23.6% Fib retracement level of the downward move from the $8,024 high to $3,860 low. However, the price seems to be facing a lot of hurdles on the upside, starting with $5,650.
There is also a key bearish trend line forming with resistance near $5,520 on the 4-hours chart of the BTC/USD pair. Above the trend line and $5,650, the main hurdle for the bulls is near the $5,965 resistance.
The 50% Fib retracement level of the downward move from the $8,024 high to $3,860 low is also near the $5,940 level to act as a resistance. The last key hurdle is near the $6,250 level and the 55 simple moving average (4-hours).
A successful close above the $5,965 and $6,250 levels is needed for the bulls to take control in the near term. Conversely, the price might fail to continue above the $5,650 and $5,965 resistance levels.
In the mentioned case, it could resume its decline below the $5,000 support level. The main support is near the $4,450 level, below which the price is likely to test the $4,000 support.

Looking at the chart, bitcoin price is clearly trading in a range above the $4,450 support. It could correct higher, but it is likely to struggle near $6,000.
Technical indicators
4 hours MACD – The MACD is slowly moving back into the bullish zone.
4 hours RSI (Relative Strength Index) – The RSI is currently correcting higher and it is above the 52 level.
Key Support Levels – $5,000 and $4,500.
Key Resistance Levels – $5,520, $5,650 and $6,000.


Leave a Reply
You must be logged in to post a comment.