- ADA price started a decent recovery after trading towards the $0.0365 support level against the US Dollar.
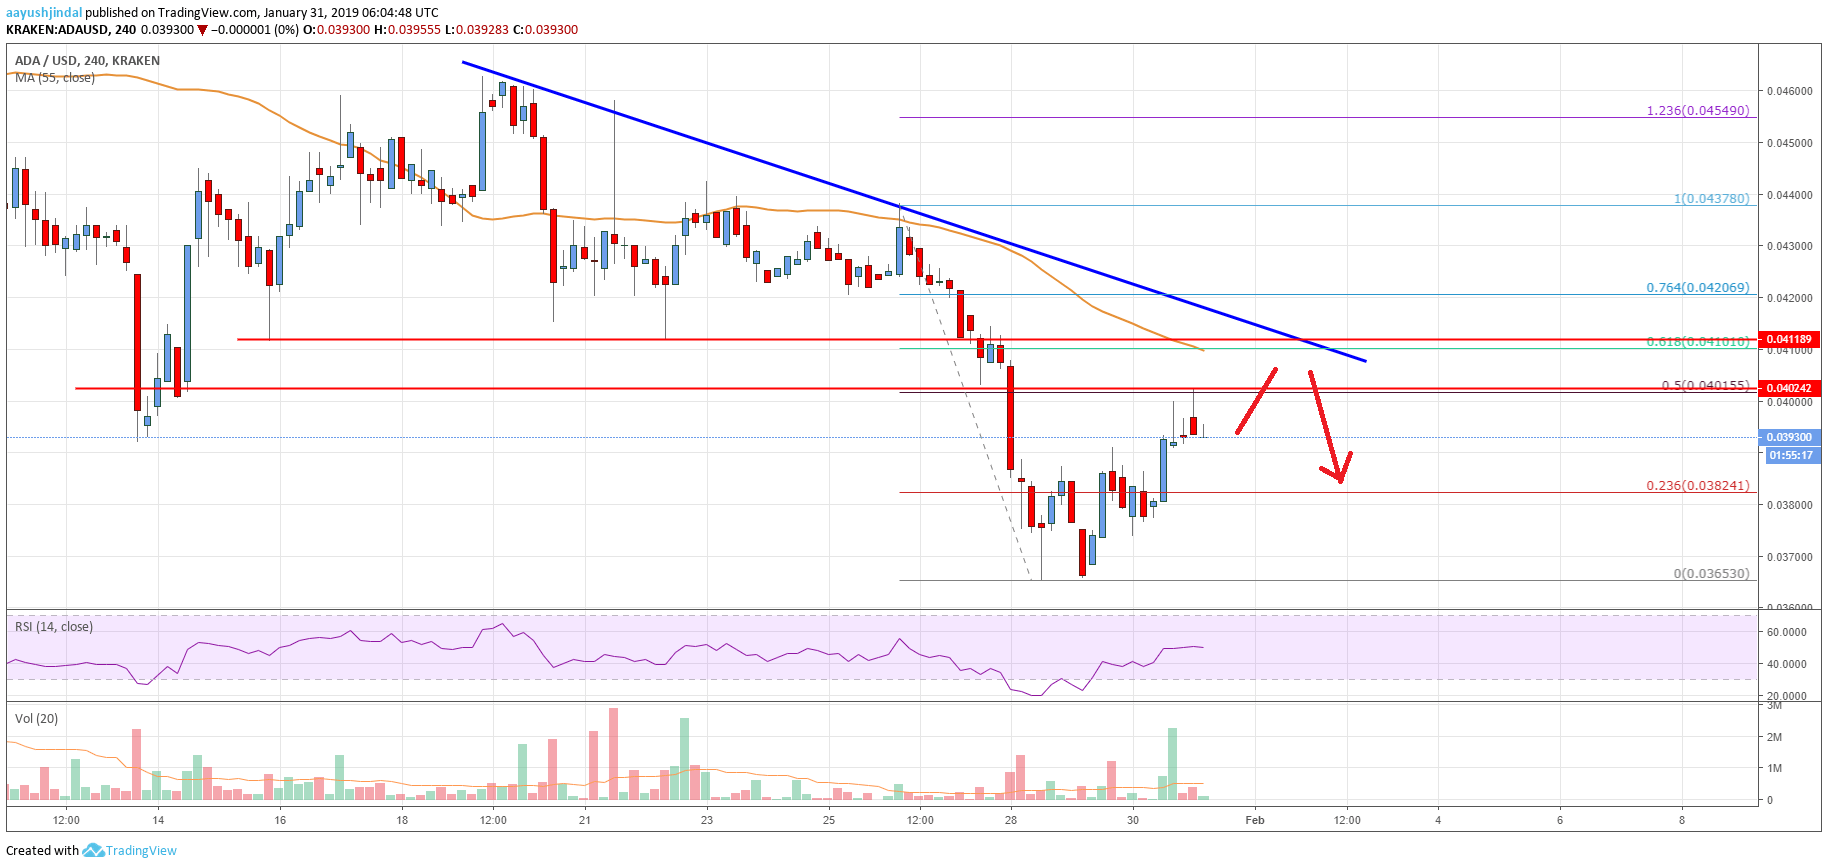
- There is a significant bearish trend line formed with resistance near $0.0410 on the 4-hours chart (data feed via Kraken).
- The price is likely to struggle near the $0.0400 resistance and it could decline once again in the near term.
Cardano price is slowly recovering against the US Dollar and Bitcoin. However, ADA is now approaching a couple of important resistance near the $0.0400 and $0.0410 levels.
Cardano Price Analysis
In the past few days, there was a steady decline in cardano price from well above $0.0400 against the US Dollar. The ADA/USD pair traded below the $0.0385 and $0.0370 support levels. It even settled below the $0.0400 level and the 55 simple moving average (4-hours). It traded as low as $0.0365 and later started consolidating losses. Finally, a decent support base was formed and the price recovered above $0.0380. The price climbed higher and broke the 23.6% Fibonacci retracement level of the last drop from the $0.0437 high to $0.0365 low.
However, the price ran into a significant resistance near $0.0400. Besides, the price struggled near the 50% Fibonacci retracement level of the last drop from the $0.0437 high to $0.0365 low. More importantly, there is a major bearish trend line formed with resistance near $0.0410 on the 4-hours chart. The same chart suggests that there is a strong resistance formed near $0.0400 and $0.0410. The 55 simple moving average (4-hours) is also placed near the trend line and $0.0410. Therefore, a successful break above the trend line and $0.0410 is must for more gains in the near term.

The chart indicates that ADA price is approaching a few important resistances near $0.0400 and $0.0410. As long as the price is below $0.0410, it could restart its decline. An initial support is at $0.0385, below which the price may revisit the $0.0372 support.
Technical Indicators
4-hours MACD – The MACD for ADA/USD is slowly moving in the bullish zone.
4-hours RSI – The RSI for ADA/USD is currently flat above the 50 level, with a positive structure.
Key Support Level – $0.0380
Key Resistance Level – $0.0410


Leave a Reply
You must be logged in to post a comment.