- EOS price started a downside correction from the $1.315 resistance against the US Dollar.
- The price is now trading above $1.18 and the 55 simple moving average (4-hours).
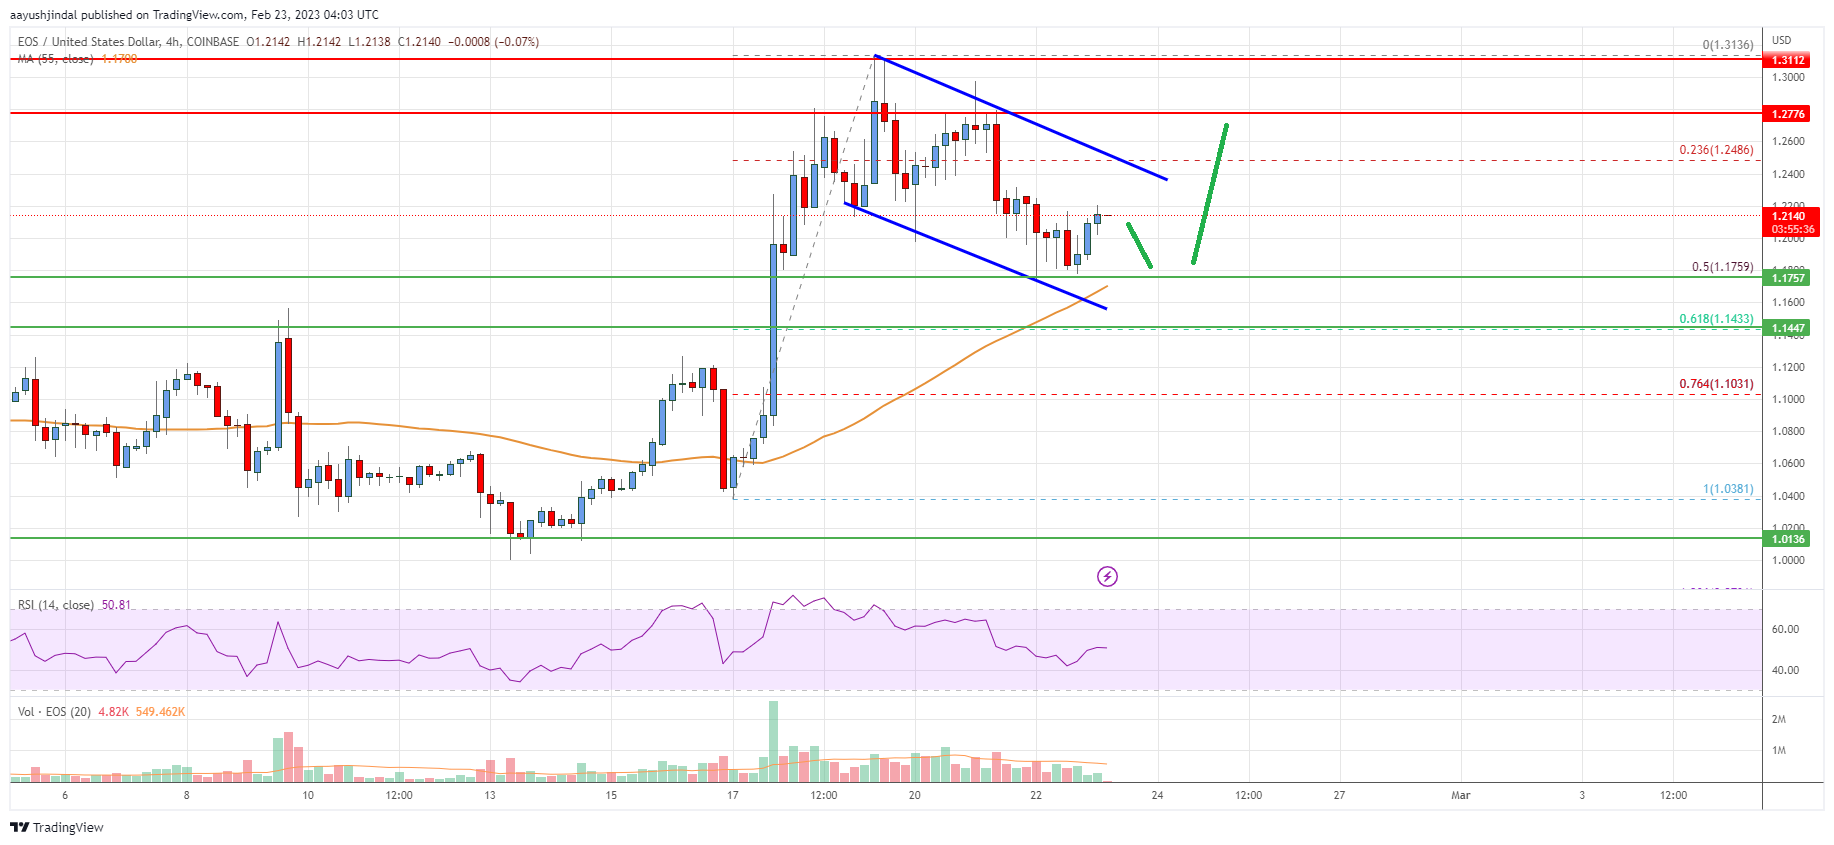
- There is a key declining channel forming with resistance near $1.24 on the 4-hours chart of the EOS/USD pair (data feed from Coinbase).
- The pair could continue to move down if it fails to stay above the $1.145 support zone.
EOS price is declining from $1.315 against the US Dollar, similar to bitcoin. The price could accelerate lower if there is a clear move below the $1.145 support.
EOS Price Analysis
This past week, EOS price climbed further higher above the $1.25 resistance zone against the US Dollar. The price surpassed the $1.30 level and settled above the 55 simple moving average (4-hours).
A new yearly high was formed near $1.3136 before the price started a downside correction. The price declined below the $1.265 support to move into a short-term bearish zone. The pair even tested the 50% Fib retracement level of the upward move from the $1.038 swing low to $1.313 high.
It is now trading above $1.18 and the 55 simple moving average (4-hours). On the downside, an immediate support is near the $1.175.
The next key support is near the $1.145. It is near the 61.8% Fib retracement level of the upward move from the $1.038 swing low to $1.313 high. If there is a downside break below the $1.145 support, the price could revisit the $1.055 support.
On the upside, an immediate resistance is near the $1.240 level. There is also a key declining channel forming with resistance near $1.24 on the 4-hours chart of the EOS/USD pair.
The first major resistance is near the $1.25 level, above which the price could rise steadily. The main resistance is still near $1.315. A clear move above the $1.315 level might call for more upsides. In the stated case, it could rise towards the $1.35 level. Any more gains might send the price towards the $1.385 level.

Looking at the chart, EOS price is now trading above the $1.18 level and the 55 simple moving average (4-hours). Overall, the price could continue to move down if it fails to stay above the $1.145 support zone.
Technical indicators
4-hours MACD – The MACD for EOS/USD is losing pace in the bullish zone.
4-hours RSI (Relative Strength Index) – The RSI is now above the 50 level.
Major Support Levels – $1.175 and $1.145.
Major Resistance Levels – $1.25 and $1.315.


Leave a Reply
You must be logged in to post a comment.