
ETH hovers near $2.1K as Binance sell pressure crosses $1.1B. Bears are pushing the c-wave lower, but a complex B-wave bounce may still interrupt the decline.
The three-wave structure off April’s high isn’t clean enough to call this done. That’s the short version.
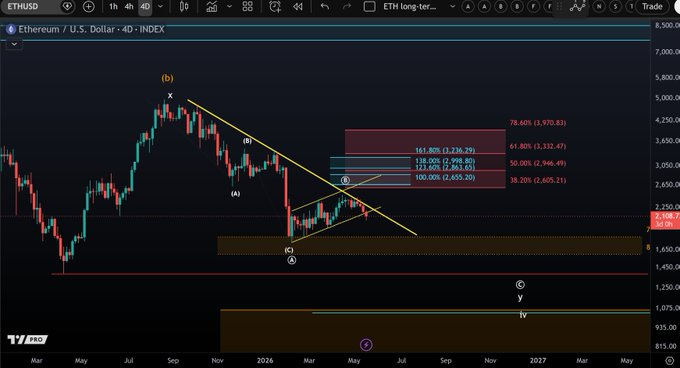
Ethereum has been sliding steadily since the April peak, with price now testing levels near $2,100 as of May 18, 2026. Bears have been in control for several sessions. The question traders seem to be sitting with is whether the current leg is the beginning of something much deeper, or just the setup before one last feint upward.
According to analyst Morecryptoonl on X, the bears are trying to initiate the c-wave to the downside. However, the current decline from April’s high remains a three-wave structure. That structure still leaves the door open for a more complex B-wave bounce before the next significant leg down takes hold. Short-term pressure, Morecryptoonl noted, is firmly pointing lower.
The chart tells part of the story. Looking at the 4-day ETH/USD chart, the structure shows a completed A-wave decline followed by a partial B-wave recovery, and now what appears to be the early stages of a C-wave. Fibonacci targets for the potential C-wave extension sit between $1,650 and the $1,450 zone — levels not tested since well before the April high.
The 161.8% extension projects even further. Meanwhile, an invalidation of the bearish count would require a sustained break back above the $2,655 to $2,946 range, which maps to the 100%–122.6% retracement zone shown on the chart.
Source: Morecryptoonl on X
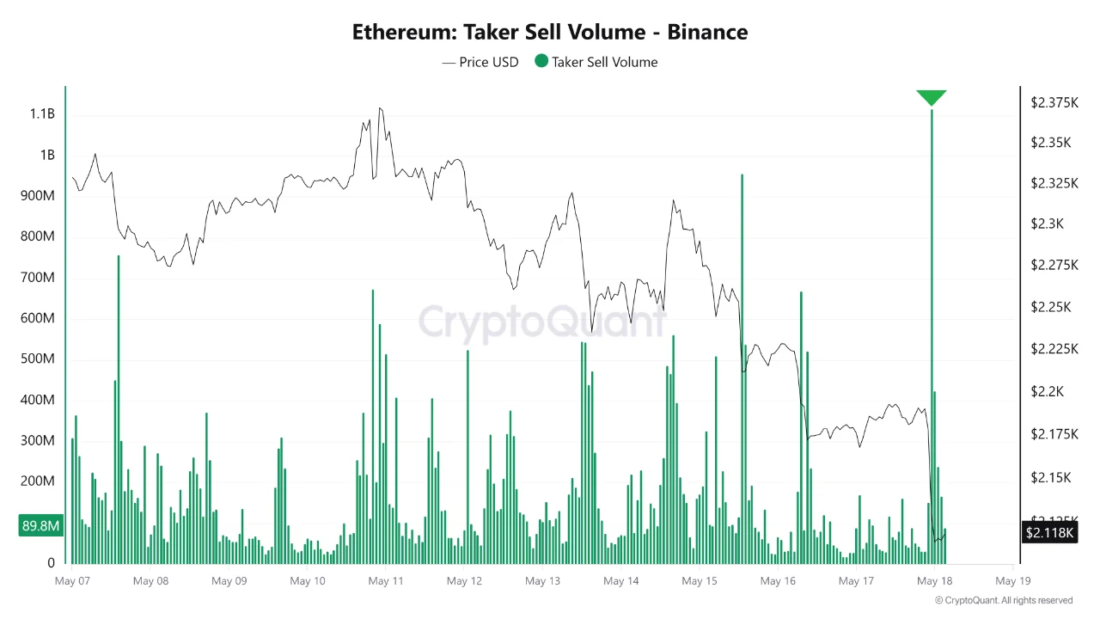
When $1.1 Billion Hits the Asks at Once
The sell-side data backing this move isn’t subtle.
According to CryptoQuant’s analysis, Binance Taker Sell Volume for Ethereum crossed above $1.1 billion as ETH pushed toward levels below $2,100. That kind of figure doesn’t come from passive limit orders sitting on the book. It reflects traders choosing to exit immediately, hitting available bids regardless of price. Forced de-risking, in plain language.
Bitcoin wasn’t spared either. Binance taker sell volume for BTC crossed the $1 billion mark twice in the same window. The first notable spike came May 15, reaching around 1.5 billion dollars. The second came as Bitcoin broke below $77,000 for the first time since early May, with another wave of aggressive selling crossing above $1.1 billion. ETH and BTC selling accelerated in near-perfect sync. That’s the part worth paying attention to.
Source: CryptoQuant’s
CryptoQuant described the pattern as synchronized cross-asset selling pressure. When two of the largest assets on the planet get hit simultaneously on the same venue, it suggests broader de-risking rather than a single-asset story. Sellers were clearly in charge of that move. Whether they stay in charge is a different question.
The B-Wave Window Is Still Open, Barely
There’s something worth noting in the structure. Three-wave declines don’t confirm a full impulsive breakdown. They leave room for interpretation.
Morecryptoonl’s reading on X, that this remains a three-wave decline from April — is significant because it means the market hasn’t technically committed to a full bearish impulse yet. That gap, however narrow, is what creates the B-wave scenario. A corrective bounce, likely choppy and frustrating, could retrace a portion of the decline before rolling back over into the c-wave proper.
The B-wave wouldn’t necessarily be large or clean. Complex B-waves tend to look like false recoveries, the kind that shake out shorts early and trap fresh longs near the top. Per the Fibonacci grid on the analyst’s chart, any bounce attempting to qualify as a B-wave would likely face resistance somewhere in the $2,605 to $2,946 range — the 100% to 122.6% zone mapped against the prior structure.
For sellers to regain confidence in the full c-wave thesis, the market would need to see aggressive sell volume cool while price stabilizes, as CryptoQuant noted. That hasn’t happened yet. Per the Binance data, taker sell volume remains elevated. Price is still under pressure near the $2,100 handle.
On recent shifts in Ethereum’s Binance volume dynamics, the picture has been shifting for weeks. ETH’s share of total Binance trading volume dropped from 27% in mid-April to around 17% as capital rotated elsewhere. That kind of structural shift in participation doesn’t reverse overnight.
The structure is incomplete. The selling is real. And the B-wave window, if it opens at all, probably won’t stay open long.


Leave a Reply
You must be logged in to post a comment.