
Ethereum trades near $2,195 as traders watch $2,100 support, while $2,600–$2,800 remains the next upside range.
Ethereum traded near $2,195.8 on the daily chart, as analysts watched a key support zone near $2,100.
The asset is attempting to recover after a sharp fall from higher levels. A move above nearby resistance could open the path toward $2,600 to $2,800.
Ethereum Holds Near Key Support Area
Ethereum is trading above the $2,100 area, which remains an important level for the current setup.
Analyst Crypto Feras said, “Below $2,100 the entire thing gets invalidated.” This level now acts as the main line for the recovery attempt.
The daily chart shows ETH trying to stabilize after a steep decline. Price has moved away from the lower range, but it remains below major resistance.
Therefore, traders are watching whether buyers can defend the current base.
if $ETH is still willing to show some serious move, then here is where it MUST be doing so
below $2100 the entire thing gets invalidated.
till then $2600-2800 is still possiblewake up Vitalik !#ETH #Trading pic.twitter.com/P8TDC5t7OP
— Crypto Feras (@CryptoFeras) May 17, 2026
ETH is also trading close to the $2,274.4 Fibonacci level. This area is seen as the first major reclaim zone. A daily close above it could support a stronger recovery phase.
However, failure to hold above $2,100 would weaken the setup. It could also return pressure to the lower support area.
For now, the market remains focused on whether ETH can hold this range.
ETH Price Eyes $2,600 To $2,800 Range
Crypto Feras said Ethereum must move from this area. Crypto Feras also said that $2,600 to $2,800 remains possible while $2,100 holds.
This range sits near the next major Fibonacci resistance zone. Ethereum first needs to clear the $2,274 to $2,300 area.
That zone has become the nearest resistance on the daily chart. A clean move above it could bring $2,500 into focus.
After that, the next key level stands near $2,735.6. This level matches the 0.786 Fibonacci retracement area shown on the chart.
It also sits inside the wider $2,600 to $2,800 target range. Still, ETH has not confirmed a full bullish reversal.
The price remains in an early rebound phase. Buyers need stronger daily closes before the move can extend higher.
Read Also:
Harvard Endowment Slashes Bitcoin ETF by 43% and Exits Ethereum ETF
Ethereum Technical Analysis Shows Mixed Signals
The broader trend remains weak after the fall from the $4,400 to $4,500 zone. ETH dropped below several Fibonacci levels during the decline.
This shows that the larger chart still needs repair. The MACD has turned more constructive on the daily chart.
The MACD line is near 18.3, while the signal line is around 14.3. The histogram is positive near 4.0, which shows improving momentum.
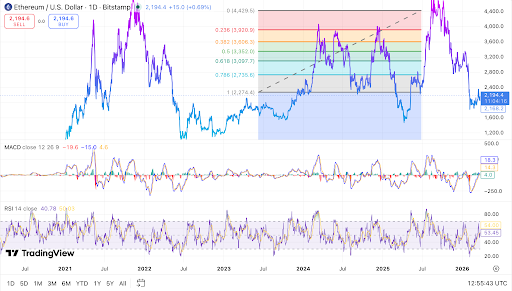
The RSI is near 53.45, while its moving average is around 54.00. This places ETH in neutral territory. It also shows that buyers have room to push higher.
Support is seen near $2,160 to $2,170 in the short term. Below that, $2,100 remains the main invalidation level.
A break under that area would weaken the $2,600 to $2,800 outlook. For now, Ethereum’s daily chart remains at a key point.
A close above $2,300 could support a move toward $2,600. A loss of $2,100 would change the current recovery setup.


Leave a Reply
You must be logged in to post a comment.