- Ethereum price is trading in a contracting range below $600 against the US Dollar.
- ETH price is currently trading near the $585 pivot and the 55 simple moving average (4-hours).
- There is a major contracting triangle forming with resistance near $596 on the 4-hours chart (data feed from Coinbase).
- The pair could either surge above $600 or decline heavily towards the $550-$560 zone.
Ethereum price is showing a few bearish signs below $600 against the US Dollar. ETH/USD is likely setting up for a major break, with a key hurdle near $598-$600.
Ethereum Price Analysis
After a couple of swing moves, Ethereum price found support near the $560 zone against the US Dollar. ETH price traded as low as $560 recently and started a fresh upward move.
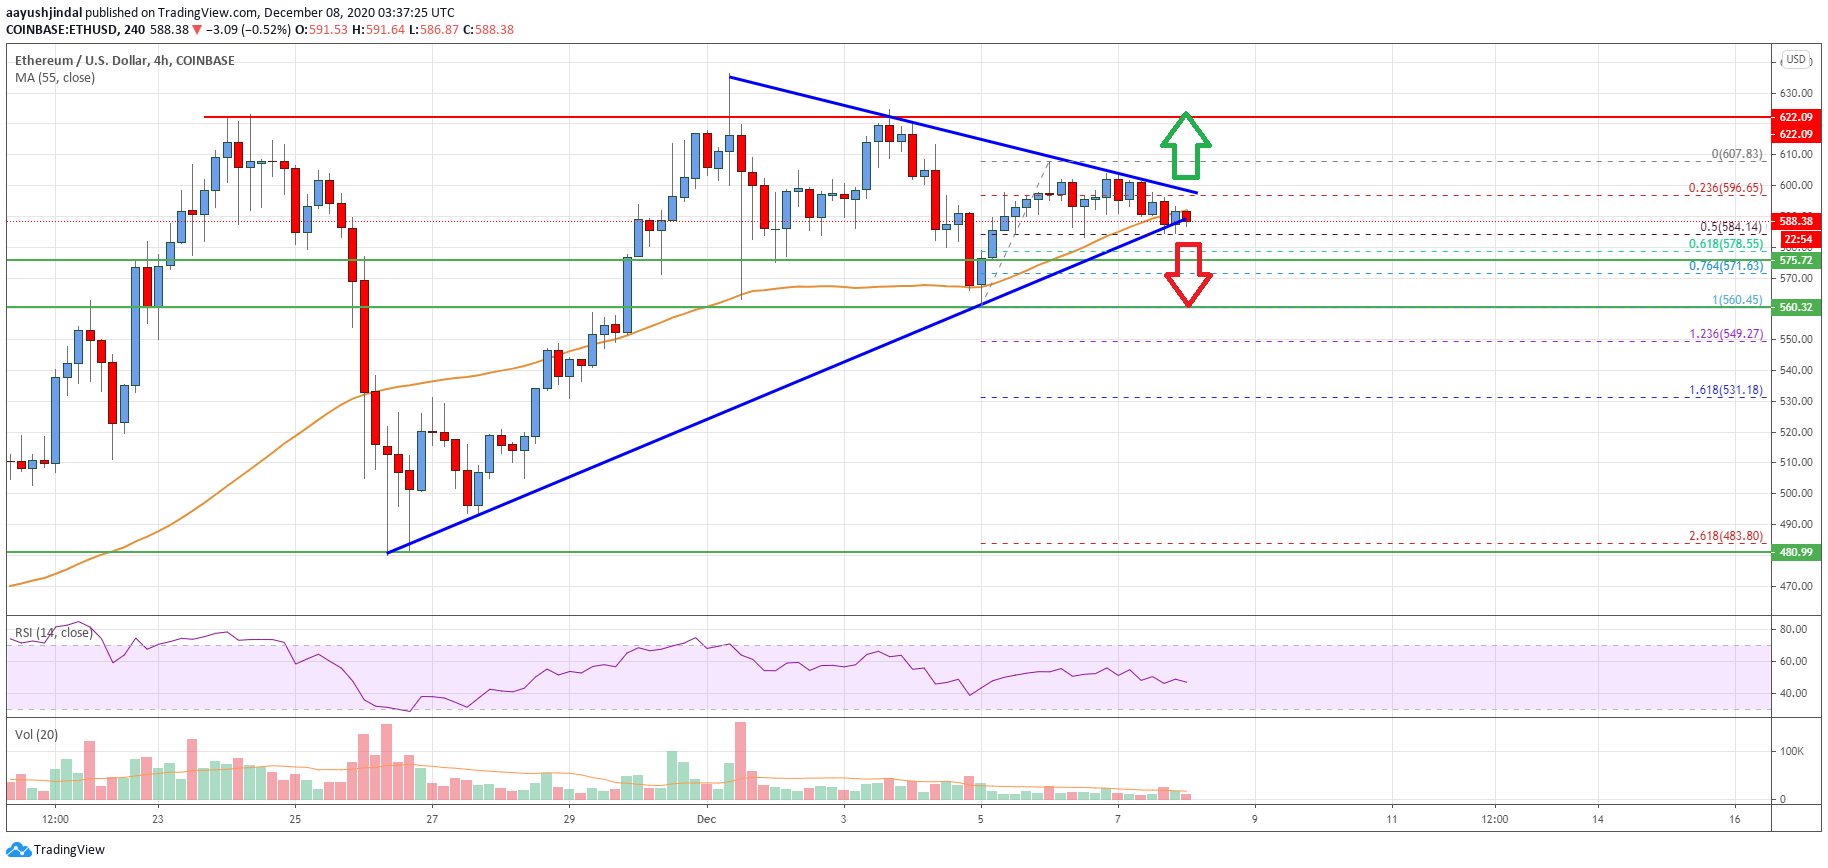
There was a break above the $585 pivot level. The price even broke the $600 level and 55 simple moving average (4-hours). A high was formed near $607 and the price failed to continue higher. It corrected lower and traded below the $590 level.
There was a break below the 23.6% Fib retracement level of the upward move from the $560 swing low to $607 swing high. It is now trading near the $585 pivot and the 55 simple moving average (4-hours).
There is also a major contracting triangle forming with resistance near $596 on the 4-hours chart. The triangle support is at $585 and the 50% Fib retracement level of the upward move from the $560 swing low to $607 swing high.
If there is a downside break below the $560 support zone, there is a risk of a sharp decline. The next major support is near the $560 and $550 levels.
Conversely, the price could break the triangle resistance and $600 to start a fresh increase. An immediate resistance is near the $607 high, above which the price might rise steadily towards the $620 and $625 levels. The next key resistance is at $635.
Looking at the chart, Ethereum price is clearly preparing for the next key break, with a major hurdle at $600. Overall, ether price could either surge above $600 or decline heavily towards the $550-$560 zone.
Technical indicators
4 hours MACD – The MACD for ETH/USD is gaining momentum in the bearish zone.
4 hours RSI (Relative Strength Index) – The RSI for ETH/USD is now below the 50 level.
Key Support Levels – $585, followed by the $560 zone.
Key Resistance Levels – $600 and $620.


Leave a Reply
You must be logged in to post a comment.