- Ethereum price is gaining pace above the $580 and $600 resistance levels against the US Dollar.
- ETH price is currently trading well above $600 and the 55 simple moving average (4-hours).
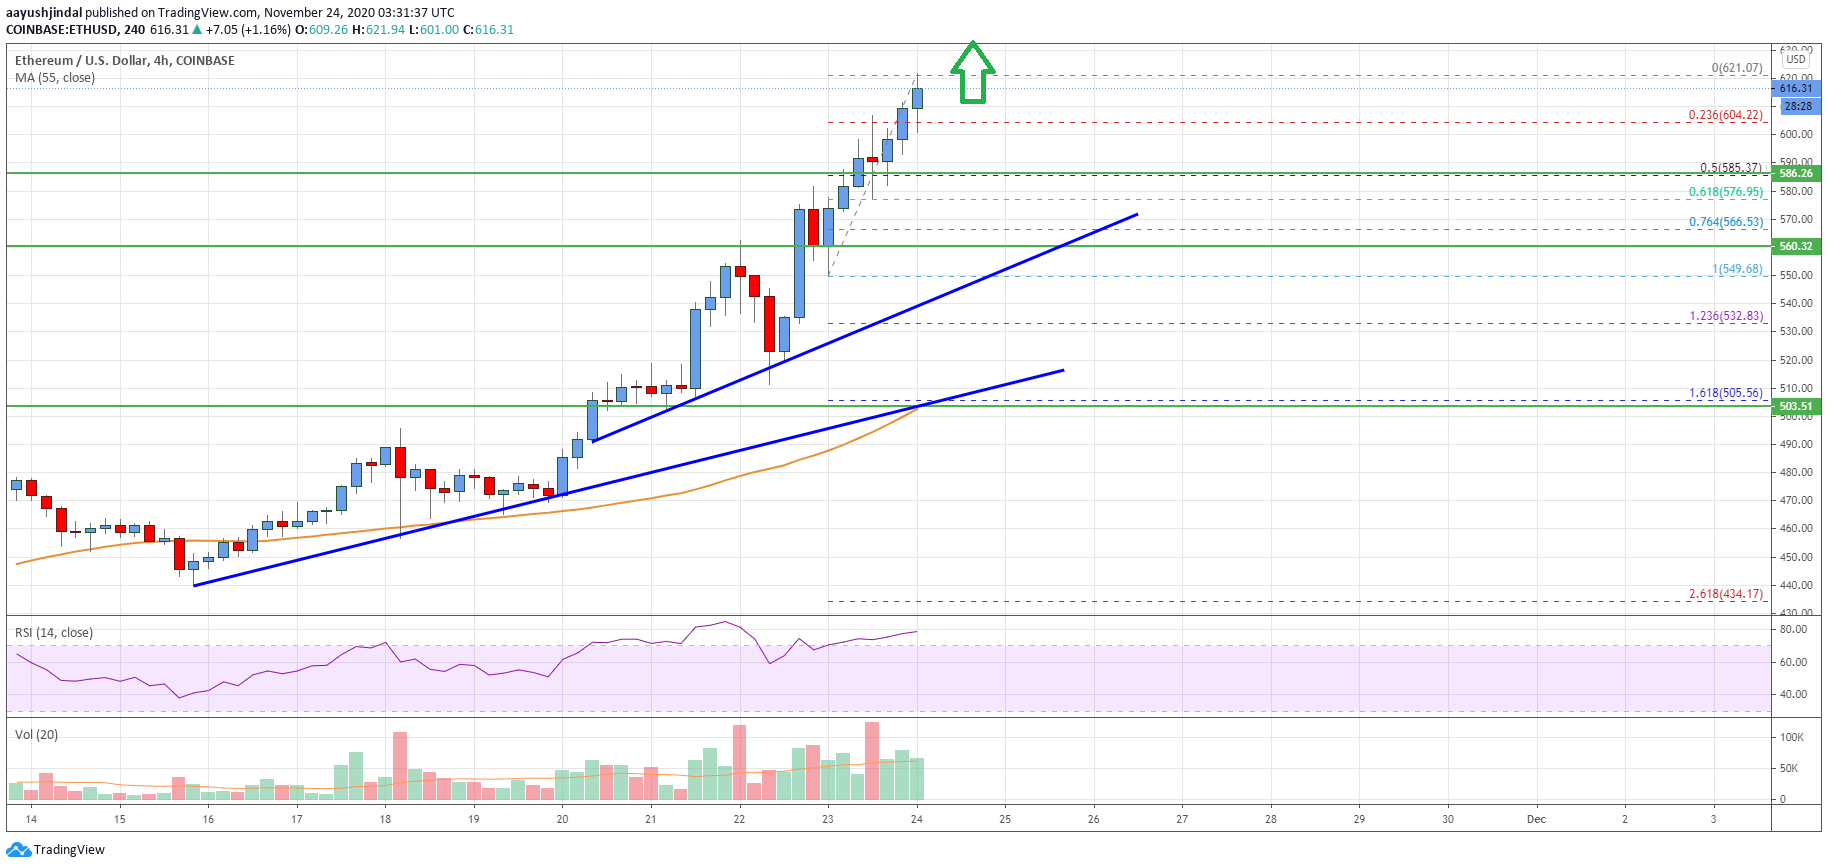
- There are two key bullish trend lines forming with support near $560 and $520 on the 4-hours chart (data feed from Coinbase).
- The pair is likely to accelerate higher above the $620 and $625 resistance levels.
Ethereum price is trading in a nice uptrend above $600 against the US Dollar. ETH/USD is likely to continue higher and dips could be limited below $600 and $580.
Ethereum Price Analysis
In the past few days, there was a strong increase in Ethereum price above the $500 barrier against the US Dollar. ETH price even broke the $550 resistance level and settled well above the 55 simple moving average (4-hours).
The price is now trading above the $600 level and it traded as high as $621. The current price action is positive and it seems like the bulls are aiming an upside break above the $625 level. The next major resistance sits near the $632 level.
A successful break above the $632 resistance might open the doors for a push towards the $650 and $660 resistance levels in the near term. If there is a downside correction, the $605 level is an initial support.
The 23.6% Fib retracement level of the recent increase from the $549 swing low to $621 high is also near the $605 level. There are also two key bullish trend lines forming with support near $560 and $520 on the 4-hours chart.
The first key support is near the $600 handle, below which the price could test the 50% Fib retracement level of the recent increase from the $549 swing low to $621 high at $585. Any further losses may perhaps lead the price towards the first bullish trend line at $560.
Looking at the chart, Ethereum price is clearly trading in a nice uptrend above $600 and $580. Overall, ether price is likely to accelerate higher above the $620 and $625 resistance levels. If there is a downside correction, the price might find bids near $600 and $580.
Technical indicators
4 hours MACD – The MACD for ETH/USD is gaining momentum in the bullish zone.
4 hours RSI (Relative Strength Index) – The RSI for ETH/USD is now above the 70 level.
Key Support Levels – $605, followed by the $580 zone.
Key Resistance Levels – $625 and $650.