
- Ethereum price is trading with a bearish bias below the $180 support against the US Dollar.
- ETH price is now facing a lot of hurdles on the upside near $180 and $182.
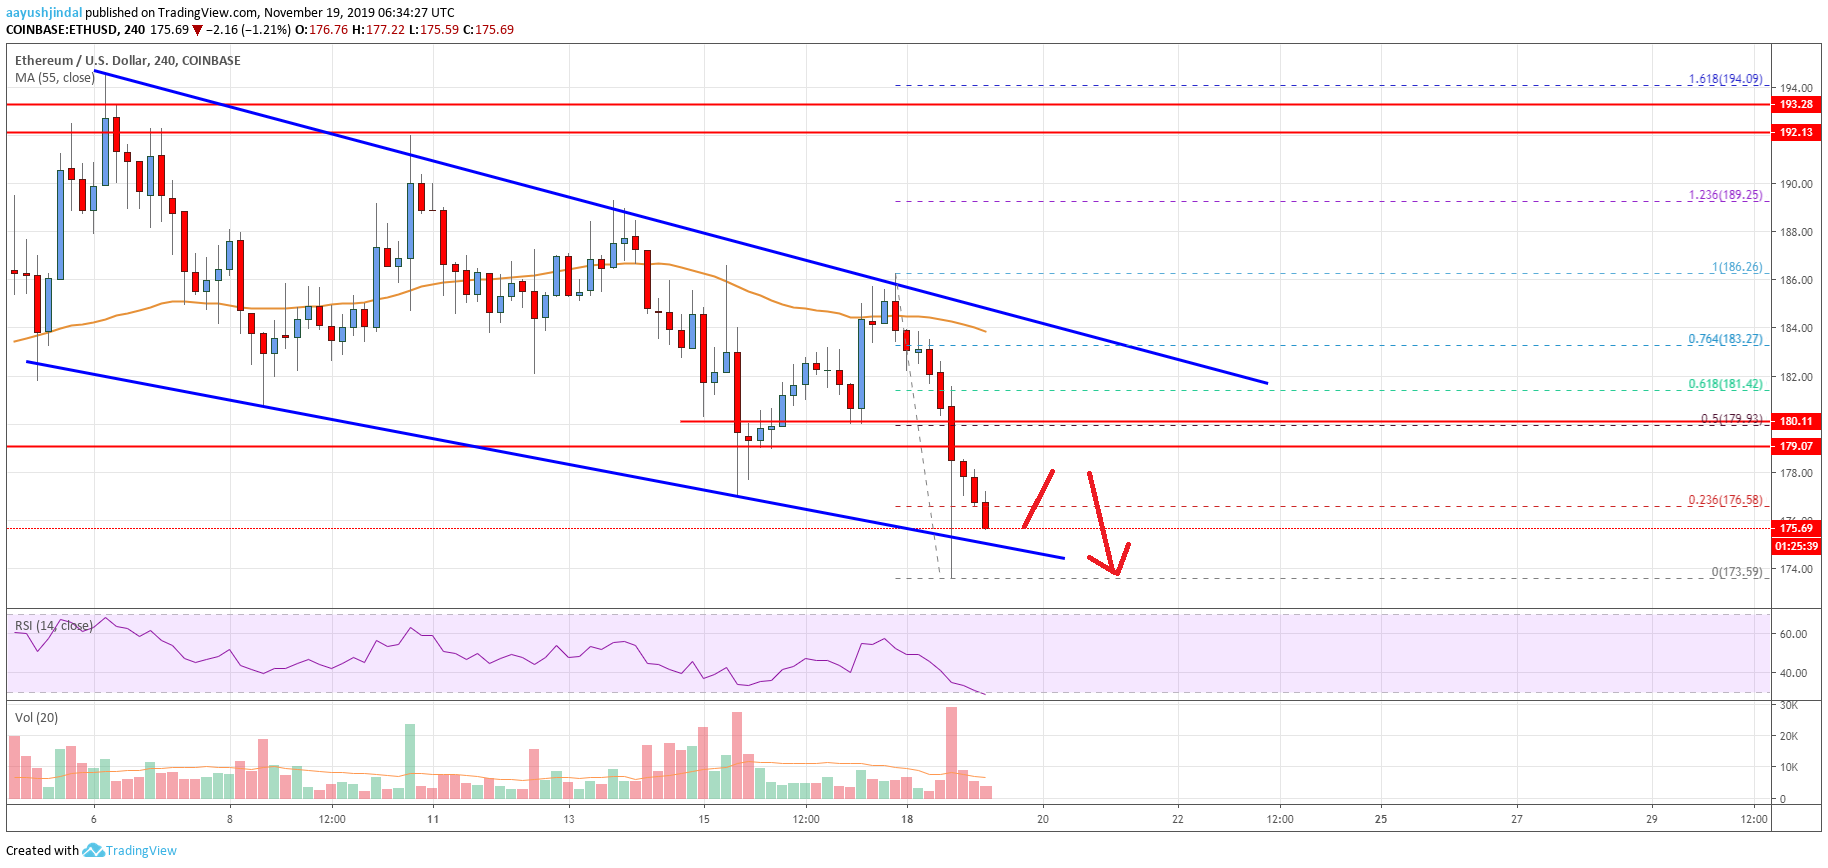
- There is a major declining channel forming with resistance near $182 on the 4-hours chart (data feed from Coinbase).
- The price remains at a risk of more losses below the $174 and $170 levels in the near term.
Ethereum price is declining below key supports near $180 against the US Dollar. ETH price is likely to struggle near $182 if there is an upside correction.
Ethereum Price Analysis
This month was mostly bearish for Ethereum price from the $195 resistance area against the US Dollar. There were steady losses in ETH price below the $190 and $186 support levels.
Moreover, there was a break below the $182 support and the 55 simple moving average (4-hours). It opened the doors for more losses below the $180 support area. Similarly, there were sharp losses in bitcoin below $8,400 and $8,200.
Ethereum gained bearish momentum below $180 and traded as low as $173.59. It is currently correcting higher above the $175 level. Besides, it traded above the 23.6% Fib retracement level of the recent drop from the $186 high to $173 low.
On the upside, there is a strong resistance forming near the $180 level (the recent breakdown support). Additionally, the 50% Fib retracement level of the recent drop from the $186 high to $173 low is near the $180 level.
More importantly, there is a major declining channel forming with resistance near $182 on the 4-hours chart. The channel resistance is near the 76.4% Fib retracement level of the recent drop from the $186 high to $173 low.
Therefore, Ethereum is likely to face a strong selling interest near the $180 and $182 levels. To move into a positive zone, the price must settle above $182 and 55 simple moving average (4-hours).
On the downside, an initial support is near the $174 level. The next key support is near the $170 level, below which there is a risk of a drop towards the $160 zone in the coming days.
Looking at the chart, Ethereum price is facing an increase in selling interest below $182 and $185. Therefore, ETH bears could aim the $160 support area if the bulls continue to struggle near $182 in the near term.
Technical indicators
4 hours MACD – The MACD for ETH/USD is currently moving heavily in the bearish zone.
4 hours RSI (Relative Strength Index) – The RSI for ETH/USD is currently recovering from the 30 level.
Key Support Levels – $174, followed by the $160 zone.
Key Resistance Levels – $182 and $185.


Leave a Reply
You must be logged in to post a comment.