
- Ethereum price is struggling to surpass the $192 and $194 resistance levels against the US Dollar.
- ETH price is somehow holding the key $182 and $180 support levels.
- There is a major bullish trend line forming with support near the $184 level on the 4-hours chart (data feed from Coinbase).
- The price could start a sharp decline if it fails to stay above the $182 and $180 support levels.
Ethereum price is showing a few bearish signs below $192 against the US Dollar. However, ETH price is still trading above the main $180 support area.
Ethereum Price Analysis
Recently, Ethereum price made another attempt to surpass the $192 and $194 resistance levels against the US Dollar. The bulls struggled to gain strength and ETH price formed a high near the $192 level.
Later, there was a bearish wave below the $190 and $188 levels. Moreover, there was a break below $185 and the 55 simple moving average (4-hours). Similarly, there were strong bearish moves in bitcoin, but ETH remained supported above the $182 level.
A low was formed near $183.78 and the price is currently correcting higher. An immediate resistance is near the $186 level. It coincides with the 23.6% Fib retracement level of the recent decline from the $192 high to $183 low.
The first key resistance seems to be near the $188 level. It represents the 50% Fib retracement level of the recent decline from the $192 high to $183 low. Besides, the main resistance for Ethereum price is still near the $192 and $194 levels.
Therefore, a successful close above $194 is needed for a strong upward move towards the $200 and $210 levels. On the downside, there are many supports near the $182 and $180 levels.
More importantly, there is a major bullish trend line forming with support near the $184 level on the 4-hours chart. If ETH fails to stay above the trend line, the next key support is near $180. Any further losses may perhaps start a major decline towards the $175 and $170 levels.
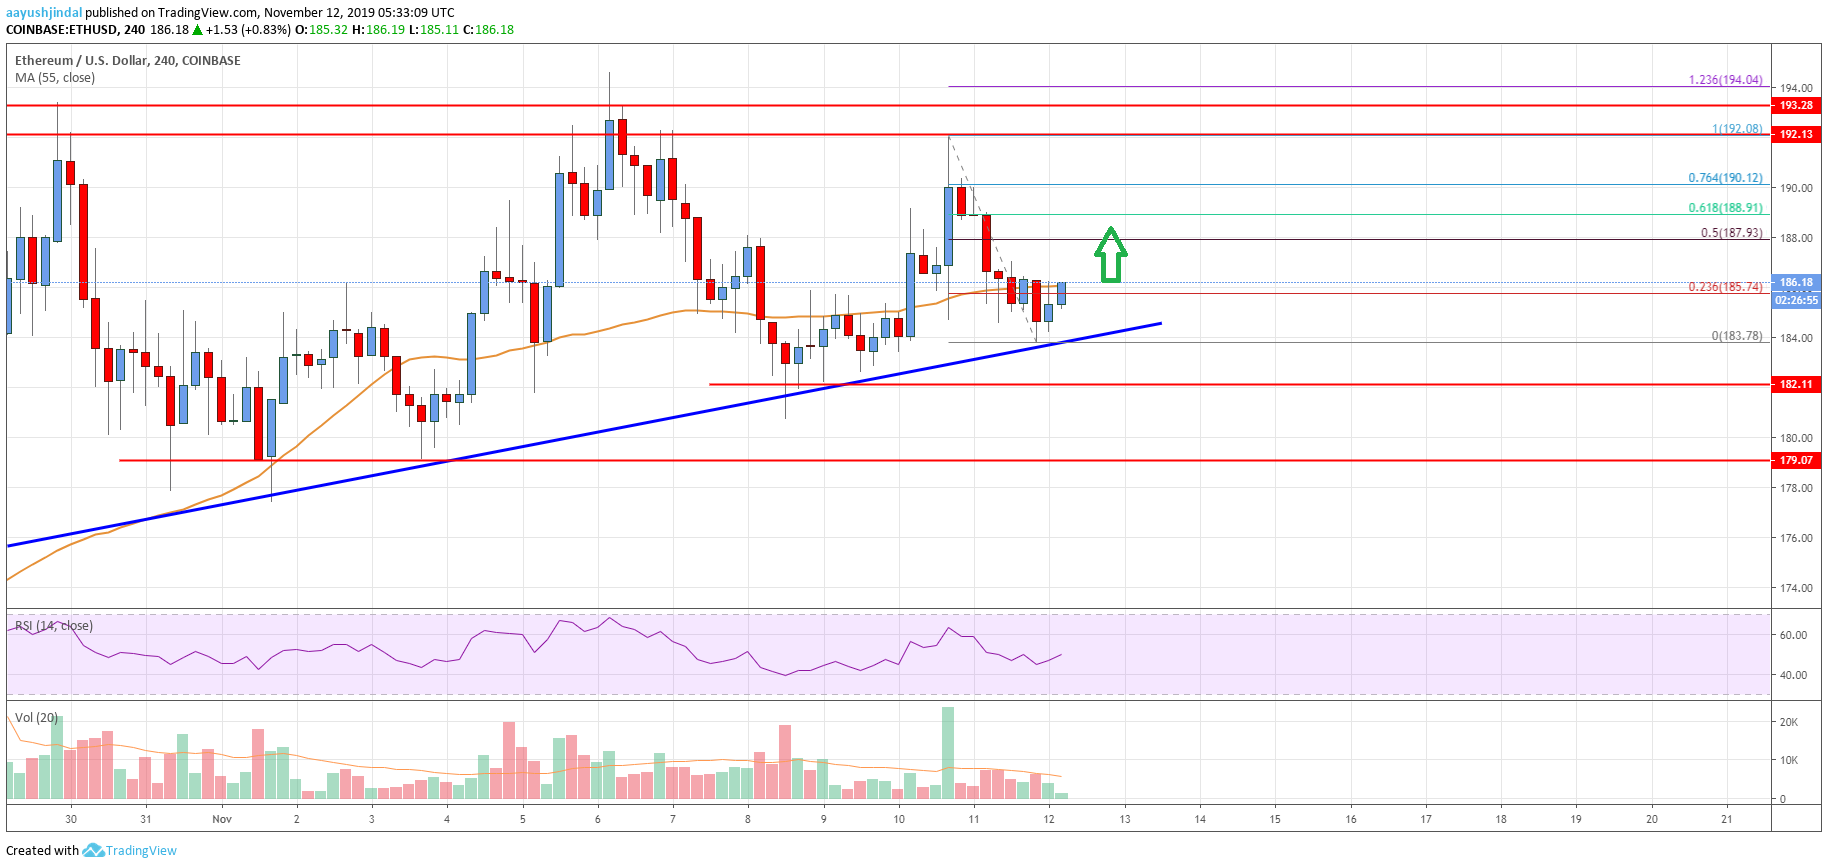
Looking at the chart, Ethereum price is clearly trading above key supports near $182 despite the recent decline. If the price fails to stay above $182 and $180, there could be a sharp decline. Conversely, a clear break above $194 could start a strong increase in the coming days. The next resistances are near $200 and $208.
Technical indicators
4 hours MACD – The MACD for ETH/USD is slowly moving in the bullish zone.
4 hours RSI (Relative Strength Index) – The RSI for ETH/USD is currently rising towards the 50 level.
Key Support Levels – $184, followed by the $180 zone.
Key Resistance Levels – $188 and $192.


Leave a Reply
You must be logged in to post a comment.